Avalanche (AVAX) Price Moves: 52 Flagged, 3 Reversed
A Coin That Rarely Takes It Back
Here is the scene that most of Avalanche's moves have in common: the candle fires, the chart jumps, and then nothing dramatic happens. No frantic unwind, no sheepish retreat to where it started. The move just sits there, like it meant to.
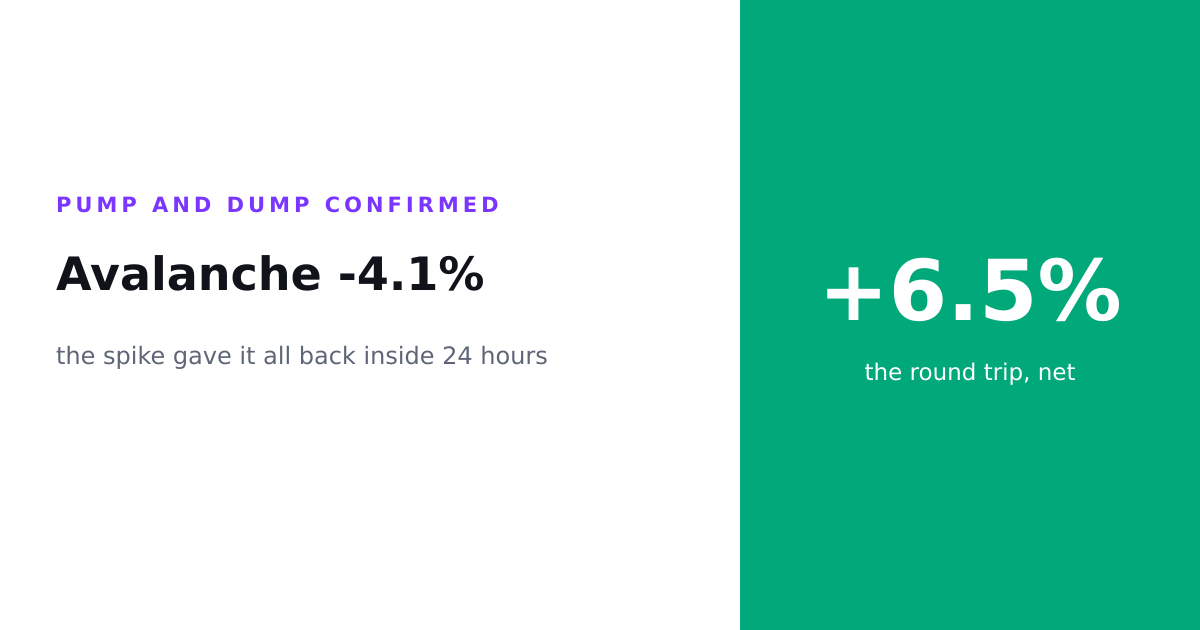
*Previously: Avalanche Climbs, Then Slides Right Back Down the Mountain*
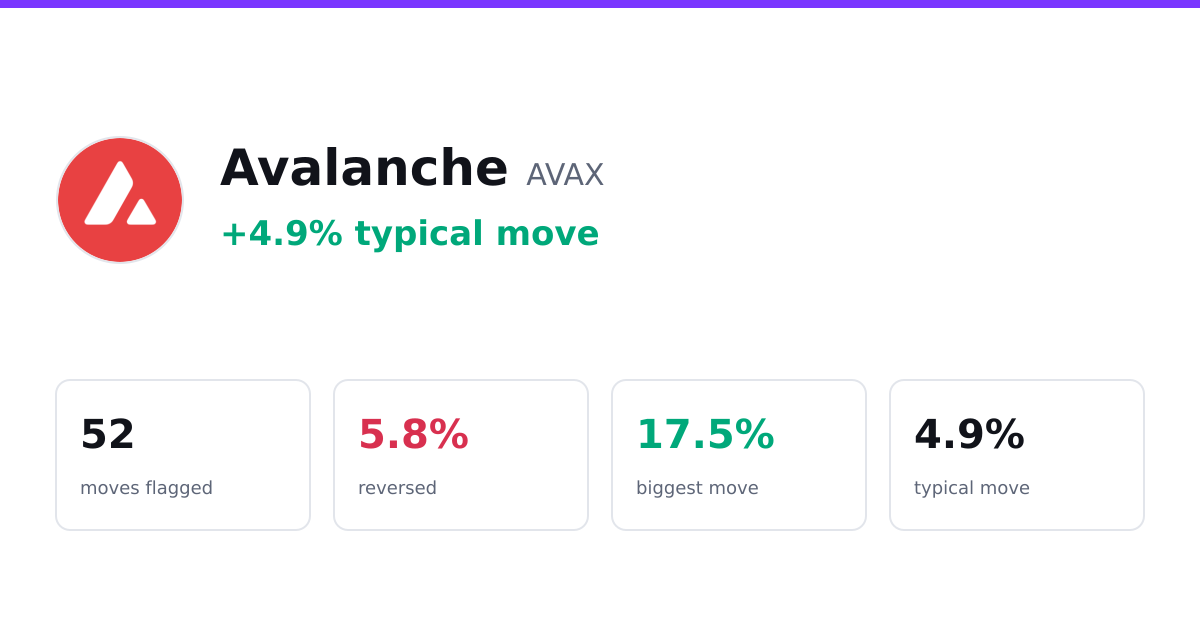
Over roughly four months, from early June to the middle of October 2026, Avalanche's price behaviour drew 52 unusual moves worth flagging. Of those, just three reversed one day later. That is a coin that, more often than not, keeps whatever it grabbed.
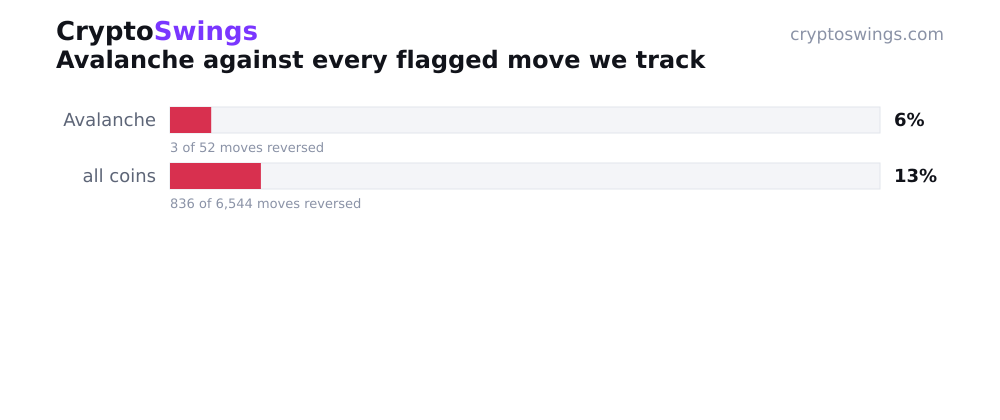
Three out of fifty-two is a reversal rate of 5.8%. In a market where sudden candles are usually auditioning for a round trip, that number stands out for how boring it is, and boring, for anyone who has watched a spike evaporate mid-afternoon, is a compliment.
The Shape Of An Avalanche
Strip the 52 moves down to their dimensions and you get a coin with a steady hand. The typical flagged move ran about 4.9%, not the kind of candle that stops conversations, more the kind that nudges you to check the tape and then go refill your coffee.
The biggest of the lot reached 17.5%. Sizeable, certainly, but a long way from the three-digit fireworks that micro-caps set off for sport. Avalanche is not in that circus. Its moves are the moves of a coin with real weight behind the ticker, where a double-digit day is an event rather than a Tuesday.
And then there is the symmetry, which is almost too neat to be real. Of the 52 flagged moves, 26 were rallies and 26 were sell-offs. Twenty-six rallies, twenty-six sell-offs, a perfect fifty-fifty ledger of enthusiasm and dread. The coin went up exactly as often as it went down, with the mountain motif doing its own quiet comedy, what goes up a slope, this one, comes down the other side in equal measure.
The point is not that the moves cancelled out. It is that Avalanche did not lean. There was no systematic bias toward green or red in what got flagged. The coin spent the stretch being pushed in both directions and, crucially, mostly stayed where each push left it.
Why The Stickiness Is The Story
Across every coin in this study, the average reversal rate sits at 12.8%. That is the baseline, the rate at which a flagged move tends to take itself back one day later. Avalanche came in at 5.8%, well under half of that.
So when Avalanche moves, it is roughly less than half as likely to walk the move back compared to the field at large. The big early flash followed by a sheepish retreat, the pattern that defines so much of the small-cap tape, is simply not Avalanche's default setting.
There is a size story buried in that. Thinner coins reverse because the move that flagged them was often a handful of orders making a lot of noise, and noise does not hold. A coin with Avalanche's depth tends to move because something actually shifted, and shifts have a way of staying shifted. The low reversal rate is less a personality trait than a byproduct of there being real market underneath the candle.
It does not make the moves tame. A 17.5% swing is a 17.5% swing. It just makes them honest, when Avalanche goes somewhere, it has mostly packed a bag and intends to stay a while.
What Counts As A Move, And How We Checked
Worth being clear about the plumbing, because the numbers only mean something if the rules behind them are fixed.
Every figure here comes from automatically flagged unusual moves, price action large enough to separate itself from the coin's ordinary fidgeting. Each flagged move was then checked against the real market price one day later. If the move held or extended, it counts as holding. If the price had snapped back the other way, it counts as a reversal.
That is the whole test. No interpretation, no mood reading, no second-guessing why a candle did what it did. A move either stuck or it did not, measured against the actual tape a day on. The 5.8% reversal rate is simply how often Avalanche's flagged moves failed that check across all 52 of them.
It is a clean definition precisely because it is unforgiving. A move that looked great for ten hours and then collapsed does not get partial credit. It is scored on where the price actually was one day later, full stop.
Does Avalanche (AVAX) Reverse Its Moves?
If you came here asking whether Avalanche tends to give back its sudden moves, the answer is no, not often. Across 52 flagged moves over about four months, only three reversed within a day, a reversal rate of 5.8%, against a 12.8% average across all tracked coins.
In plain terms: when Avalanche printed an unusual candle during this stretch, the overwhelming majority of the time that candle was still roughly where it landed a day later. The coin showed far more follow-through than the typical name in the field, and it did so without favouring one direction, the rallies and sell-offs split exactly down the middle at 26 apiece.
That is the direct read. A mid-weight coin with a habit of meaning what it charts, moving a typical 4.9% when it moves, topping out at 17.5% on its loudest day, and walking almost none of it back.
The Edges Of What This Can Tell You
Now the honest part, because a clean number invites more confidence than it has earned.
This is a record of what already happened. It is not a forecast, and nothing here says Avalanche will keep reversing at 5.8%. Fifty-two moves is a solid stretch to look at, but it is a specific stretch, June 5 to October 14, 2026 - and the market that produced it is the only market it describes. A different quarter with a different tone could draw a different shape, and this data would have no way of warning you in advance.
The window is also fixed by design. Every outcome is measured one day later and no further. A move that held for a day and then unravelled on the second day reads as a hold here, because the second day is simply outside what this test looks at. Stickiness within a day is not the same as stickiness forever, and it would be a mistake to stretch the one into the other.
And the tidy fifty-fifty split between rallies and sell-offs is a description, not a promise. It tells you the flagged moves happened to divide evenly across this particular run. It does not mean the next twenty-six-and-twenty-six are waiting in the wings.
What would change the picture? A new stretch of tape, for one, a stormier market, or a quieter one, would reshuffle both the number of flags and how many of them hold. A longer measurement window would catch the slower reversals this one misses. And any reading of a thinly populated slice of the data has to be handled gently; small buckets make loud claims on thin evidence, which is exactly why the honest move is to lean on the full set of 52 rather than any one corner of it.
Strip all that away and what remains is modest but real. Over four months, Avalanche moved often, moved in both directions equally, and kept what it grabbed far more reliably than the market around it. The mountain, so far, has held its ground.