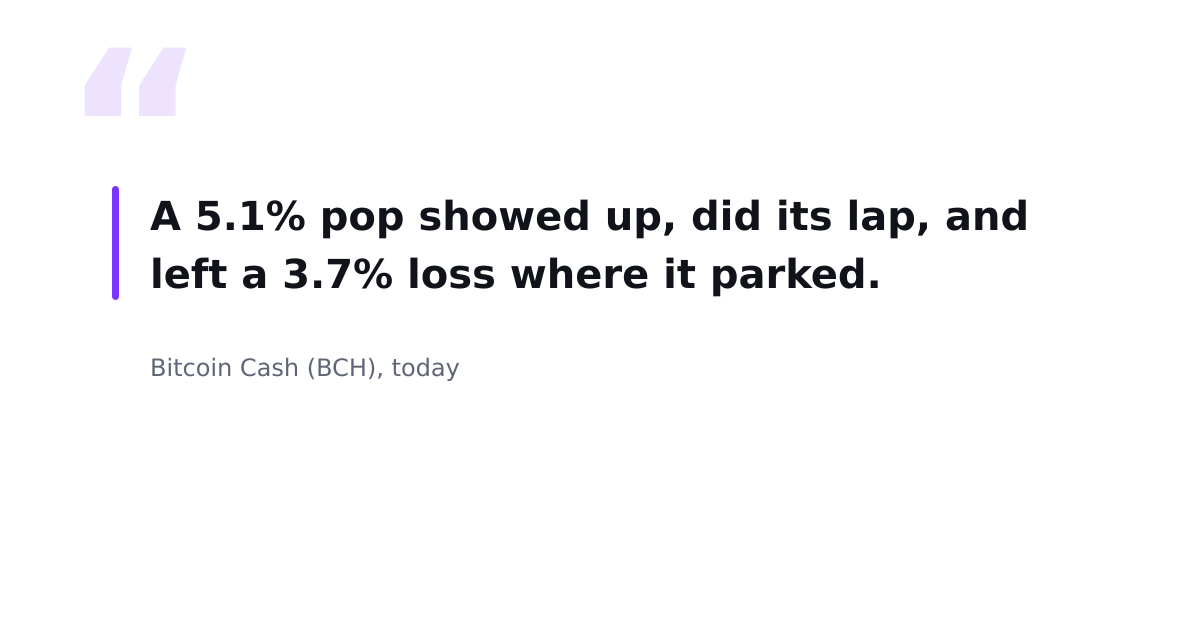
Bitcoin Cash (BCH) Price Moves: 62 Flagged, 1 Reversed
The broad market has spent recent weeks doing its usual thing, chopping sideways while the small coins out at the edges provide all the fireworks. Bitcoin Cash is not a small coin, and it is not where you go looking for fireworks. But it has been quietly doing something that deserves a second look.
*Previously: Bitcoin Cash Spikes 5.1%, Lands the Day at a Loss*
Sixty-Two Alarms, One Change of Heart
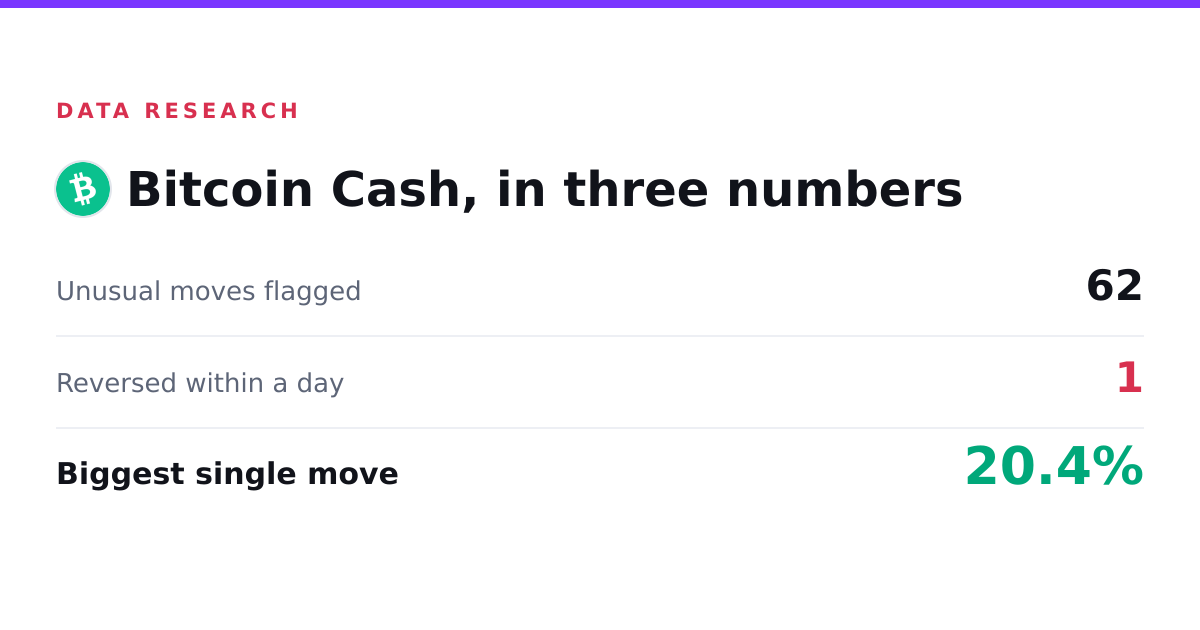
Between June 8 and November 8, 2026, Bitcoin Cash tripped the unusual-move alarm sixty-two times. Of those sixty-two moves, exactly one reversed within a day.
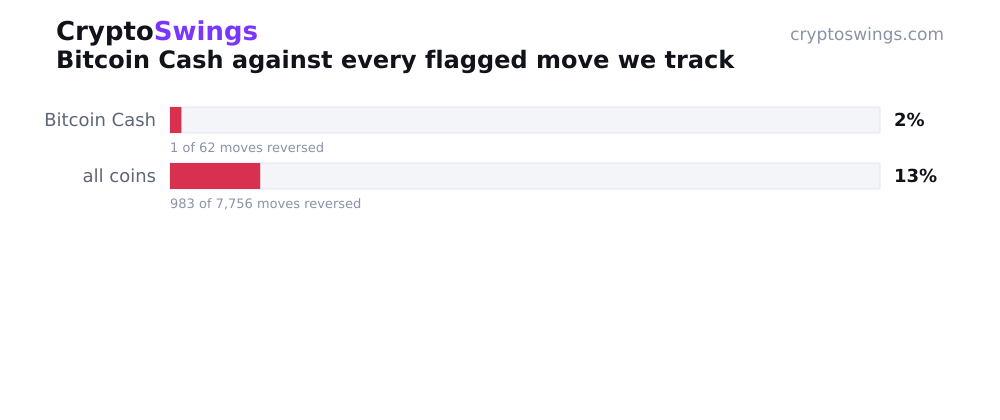
One. Out of sixty-two. That is a reversal rate of 1.6 percent, which is another way of saying that when Bitcoin Cash makes an unusual move, it almost always means it. The price goes somewhere and it stays there, at least over the span this data measures. There is no second thought, no quiet walk-back, no shrug the next day.
Most coins are not like this. Most coins make a loud move and then spend the following session reconsidering it. Bitcoin Cash just commits.
The Shape of a Committed Coin
So what do these moves actually look like? Smaller than you might guess from all this talk of alarms.
The typical flagged move for Bitcoin Cash came in at 4.9 percent. That is a real jolt for a coin of this size, enough to register as unusual, but it is a world away from the triple-digit spasms you see from the micro-caps. This is a large, liquid asset behaving like one. It does not teleport. It moves in deliberate steps.
The biggest single move over the whole five months topped out at 20.4 percent. That is the high-water mark, the one outlier that stretched further than all the rest, and even it stays inside the bounds of something you could explain with a straight face.
Then there is the direction of all this motion, and here the tape has a slight lean. Of the sixty-two flagged moves, twenty-five were rallies and thirty-seven were sell-offs. So the alarm went off more often on the way down than on the way up. Bitcoin Cash, over this window, was a little more inclined to drop sharply than to spike sharply, and whichever way it went, it tended to stay gone.
When Staying Put Is the Story
Here is the part that makes the record stand out. Across every coin tracked, the average reversal rate sits at 12.7 percent. That is the baseline, roughly one unusual move in eight tends to unwind itself the next day, give or take, across the whole field.
Bitcoin Cash came in at 1.6 percent.
Put those two figures side by side and the gap does the talking. The typical tracked coin reverses about eight times as often as Bitcoin Cash did. Where the average coin makes a big move and then thinks better of a chunk of it, Bitcoin Cash made sixty-one of its sixty-two big moves and never looked back. Only once in five months did a flagged move get taken back within a day.
That is unusual, and it is worth being precise about what kind of unusual. It does not mean the moves were calm, a 4.9 percent typical swing is not calm. It means they were durable. When this coin moved, the move held. If you are the sort who studies price behaviour the way some people study CryptoSwings box scores, that durability is the single most interesting line in the whole dataset.
What Counts, and How the Count Is Settled
A word on the plumbing, because the numbers only mean something if you know what they measure.
Every figure here comes from automatically flagged unusual moves, price action big enough and fast enough to stand out from the coin's ordinary background noise. Each flag is a snapshot of a moment the market did something notable. That is the setup.
The resolution comes one day later. The outcome of each flagged move gets measured against the real market price a day after the flag. If the move held, it counts as held. If the price had wandered back and undone the move, it counts as a reversal. No guesswork, no interpretation, just the flag, and then the price one day later, and the comparison between them.
That is the entire mechanism behind the headline. Sixty-two flags. Sixty-two checks a day later. One of them came back. The other sixty-one did not.
Do Bitcoin Cash Price Moves Reverse?
If you came here asking whether Bitcoin Cash price moves tend to reverse, the direct answer is no, almost never, over the span measured here.
The number behind that answer is 1.6 percent. Out of sixty-two unusual moves flagged between June 8 and November 8, 2026, a single one reversed within a day. That is the whole case. Against an all-coin average reversal rate of 12.7 percent, Bitcoin Cash was dramatically stickier than the typical tracked asset. Its moves, whether the twenty-five rallies or the thirty-seven sell-offs, overwhelmingly held their ground a day later.
So if the mental model you were carrying was that a sharp Bitcoin Cash move is likely a head-fake that snaps back, the record for this window points the other way. These moves stayed.
What This Record Does Not Tell You
Now the honest part, because a clean number invites overconfidence and overconfidence is how people get hurt.
This is a record of what already happened. It is not a forecast, and nothing in it promises that the sixty-third flagged move will behave like the sixty-two that came before. A 1.6 percent reversal rate over five months describes the past with real precision. It says nothing guaranteed about tomorrow. Patterns this strong can persist for a long time and then quietly stop, and the data would not warn you in advance, it only ever reports after the fact.
The window is fixed, too. June 8 to November 8, 2026, and not a day outside it. A different stretch of months, a wilder one, a calmer one, one with a market-wide shock dropped into the middle, could reshuffle every figure here. Five months is enough to notice something real. It is not enough to call it permanent.
There is also the matter of scope. This counts only moves big enough to get flagged as unusual. The ordinary day-to-day drift of Bitcoin Cash, the small moves that never trip the alarm, are not in this dataset at all. And where a dataset is built on flagged moves, categories with too few cases to say anything meaningful get left out rather than dressed up as signal. What you are looking at is the stuff that stood out, measured cleanly, and nothing more.
What would change the picture? More time, for one, extend the window and the rate could drift. A stretch of genuine market chaos, for another, since reversal behaviour under stress can look nothing like reversal behaviour in quiet conditions. And simply more flagged moves, which would either harden this pattern into something you can lean on or start to soften its edges.
For now, though, the record reads the way it reads. Sixty-two unusual moves. One that came back. A coin that, over these five months, said what it was going to do with the price and then went ahead and did it, no takebacks, no second thoughts, just a tape that meant it almost every single time.