Crypto Pump and Dump Detector: 4,825 Spikes vs 2,092 Sell-Offs
Two Numbers That Refuse to Match
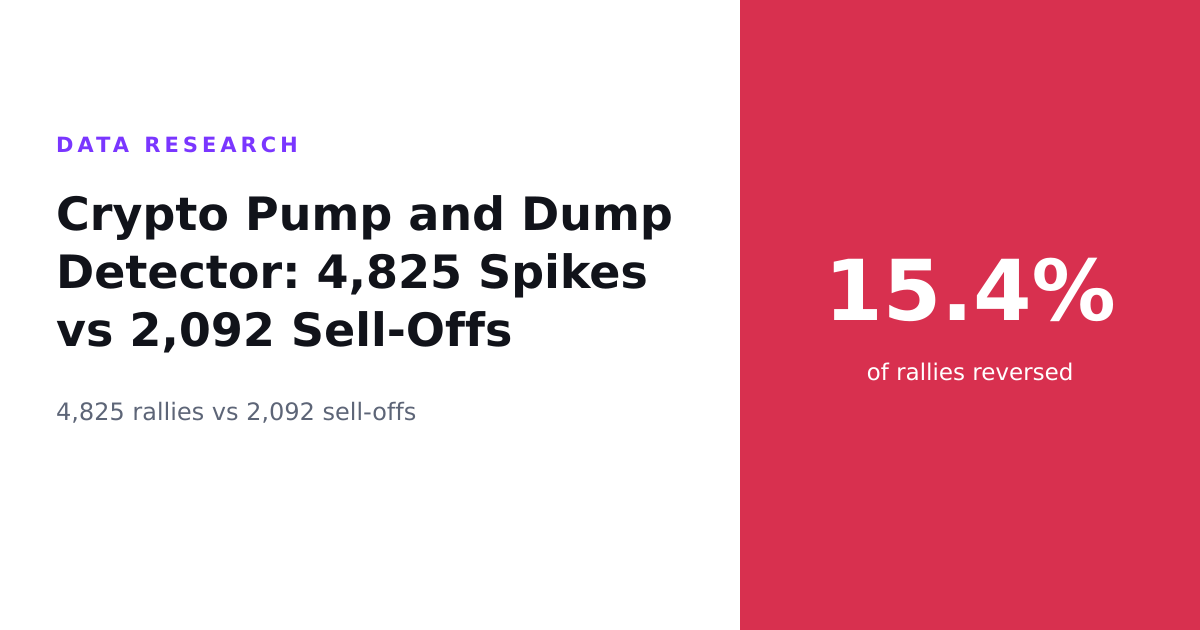
15.4 against 6.3. That is the whole argument in a single comparison, and it is the first thing a crypto pump and dump detector turns up once you let it run across enough moves. A sudden spike reversed within a day 15.4 percent of the time. A sudden sell-off reversed only 6.3 percent of the time. Same market, same clock, wildly different odds depending on which direction the candle pointed.
The samples are not small, either, which is what makes the gap worth staring at. The study covered 6,917 flagged unusual moves in total: 4,825 rallies and 2,092 sell-offs. Of the rallies, 741 reversed. Of the sell-offs, 131 did. So a spike was more than twice as likely to collapse as a sell-off was to bounce.
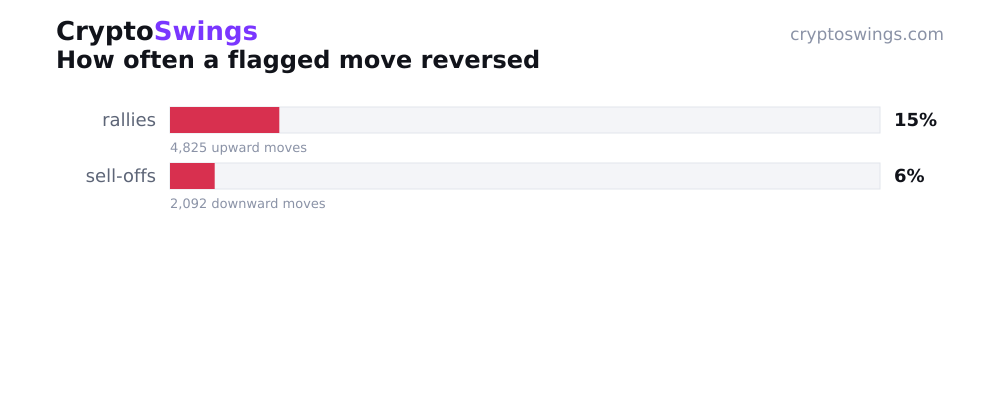
Flip the reversal figures over and you get the other side of the same coin. Rallies held their ground 84.6 percent of the time. Sell-offs held an even firmer 93.7 percent. Whatever gravity does to a spike, it does less of it to a slide.
The Half Nobody Talks About
Reversing is only one thing a move can do. The louder question is whether it keeps running, and here the two directions swap personalities.
Sell-offs, it turns out, had more follow-through. When a coin dropped hard, it kept dropping 47 percent of the time. Rallies carried on climbing only 38 percent of the time. So the direction more likely to snap back cleanly was also the direction less likely to extend. A spike reverses more often and continues less often. A slide reverses rarely and more often grinds further down.
Now do the arithmetic on what is left. A rally reversed 15.4 percent of the time and kept climbing 38 percent of the time, which leaves a big middle that did neither cleanly. Same for the sell-offs, with 6.3 percent reversing and 47 percent extending. The majority of flagged moves, in both directions, drifted into something messier than a tidy reversal or a tidy continuation. Most price action after an unusual move is not a clean verdict. It is a shrug with teeth.
That middle is where most of the drama lives and where most of the clean stories fall apart. The chart that gaps up and then wobbles sideways for a day is not satisfying to write about, but it is the single most common thing that happens.
Watching a Coin Spike in Real Time
So you are looking at a coin that just jumped. What does this record actually say about the scene in front of you?
It says the jump you are watching sits in a category where collapse is the exception, not the rule. Most spikes in the sample held. But it also says that category is distinctly more fragile than its mirror image. The same dataset that saw sell-offs reverse only 6.3 percent of the time saw spikes reverse at better than double that rate. If you ever had a gut feeling that green candles feel more fragile than red ones, the numbers are not going to talk you out of it.
None of that is a signal about any particular coin. A move being unusual is not a promise about where it goes next, and the dataset does not pretend otherwise. What it offers is context: when something spikes, the full range of outcomes is wider and tilts a little more toward the downside than when something dumps. The direction of the surprise changes the shape of the odds. That is the finding. What anyone does with it is a separate matter the data stays well out of.
How a Move Earns a Flag
A quick word on plumbing, because the numbers only mean something if you know how they were made.
Every move in this study was flagged automatically. The system does not wait for a human to notice a chart looking strange. It watches for unusual price behaviour, trips when a move stands out from a coin's normal rhythm, and logs it the moment it crosses the line. That is the whole job of a crypto pump and dump detector: catch the abnormal candle while it is still happening, not three days later in the post-mortem.
Then comes the part that turns a flag into data. Each flagged move was checked against the real market price one day later. Not a model price, not a simulated fill, the actual price the market was trading at after a day had passed. Reversed, held, or kept going: every one of the 6,917 moves got sorted by what the tape genuinely did next. No opinions in the pipeline, just a before and an after.
What a Crypto Pump and Dump Detector Can and Can't Tell You
Here is the question as a reader would type it: does a crypto pump and dump detector actually tell you whether a spike will hold?
Direct answer: no, and the numbers say why. Across 4,825 flagged rallies, 84.6 percent held and 15.4 percent reversed within a day. That is a frequency, not a fortune. It describes what spikes as a group tended to do, and it leans heavily toward holding, but it cannot point at the specific coin on your screen and call its next move. The detector tells you a spike has happened and what spikes like it have historically done. It does not tell you which bucket yours lands in.
That distinction matters more than it sounds. A 15.4 percent reversal rate means roughly one in a bunch of spikes folded, and it means the rest did not. Both facts are in the same number. Read it as "spikes mostly hold" and you are right. Read it as "this spike will hold" and you have quietly swapped a group frequency for an individual guarantee the data never signed off on.
The Honest Edges of the Dataset
Now the part that keeps the whole thing honest.
This is a record of what happened, not a map of what will. Every figure here is a rear-view mirror. The 15.4 and the 6.3, the 38 and the 47, all of it describes moves that have already resolved. The market has no obligation to repeat itself, and a dataset of past behaviour is exactly as predictive as that sentence allows, which is to say not very.
The measurement window is fixed, and that fixes what you can see. Everything was judged one day later. A spike that held for a day and crumbled on the second day counts as a hold here, because the second day is simply outside the frame. A different window would almost certainly draw different lines. Stretch the horizon and some of those held rallies might reclassify; shorten it and some reversals might never register at all. The numbers are true to their window and only their window.
And the buckets with too few cases were left out. A frequency built on a handful of moves is noise wearing a decimal point, so thin slices got excluded rather than dressed up as findings. That keeps the headline rates trustworthy, but it also means this study speaks to the common cases and goes quiet on the rare ones.
So what would change the picture? A longer or shorter measurement window, for one. More data filling in the corners that got trimmed, for another. And simply more time, because a market that behaves differently going forward will write a different file. Until then, the record stands as it is: a spike reversed more than twice as often as a sell-off bounced, most moves of either kind landed somewhere in between, and the tape, as ever, kept its own counsel about tomorrow.