Crypto Pump and Dump Rates by Coin Size: 3,140 Moves Analyzed
One Number, Four Weight Classes
Start with the cleanest fact in the whole dataset. A flagged move in the market's smallest coins reversed nearly three times as often as the same kind of move in its largest, 2.9 times to be exact. That is not a hunch or a vibe. It comes from 3,140 unusual moves tracked since June 5, 2026, of which 384 turned around and gave the move back within a day.
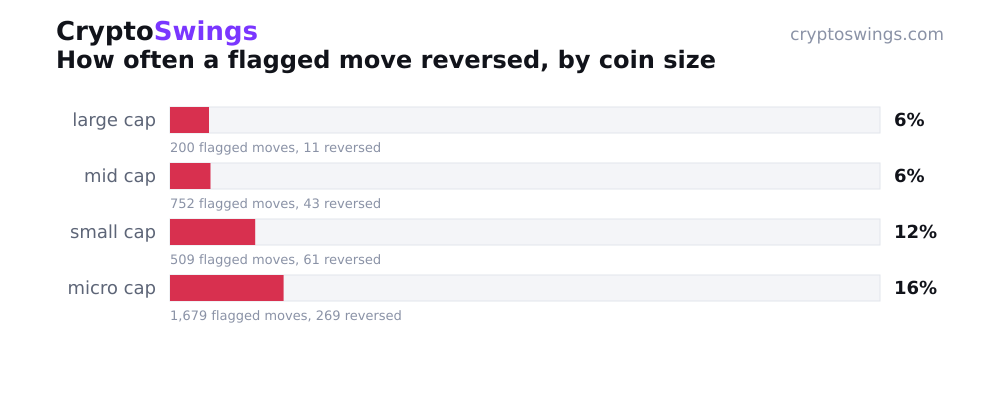
Everyone who watches the small end of the market has a gut feeling about this. The point of running the numbers is that you no longer have to trust your gut. The gut, in this case, was right, and it was right by a wider margin than most people would guess.
Walking Down the Ladder
Split those 3,140 moves into four bands by coin size and the picture sorts itself into two very different worlds.
At the top, the large coins. Two hundred flagged moves, eleven of them reversed. That works out to a 5.5 percent reversal rate, meaning better than nineteen out of twenty of these moves were still standing a day later. When a big coin moves, it tends to mean it.
The mid-caps behave almost identically. Seven hundred fifty-two flagged moves, forty-three reversals, a 5.7 percent reversal rate. Statistically that is the large-cap band wearing a slightly different hat. Two decimal points apart. If you drew a line between the two, you would need a magnifying glass to find it.
Then the floor drops.
Down in the small-caps, 509 flagged moves produced 61 reversals, a 12 percent rate. That is more than double what the mid-caps managed, and the jump happens over what feels like a single step down the size ladder. One tier lower, one rung of liquidity gone, and the reversal rate roughly doubles.
The micro-caps take it further still. This is the biggest band by far, 1,679 flagged moves, more than half the entire sample, and 269 of them reversed. A 16 percent rate. Roughly one flagged spike in six had unwound within a day. There is no floor beneath this band. It is the floor.
Why the split lands where it lands is not complicated, and the data does not ask you to invent a story. Big coins sit on deep order books. It takes real money to move them and real money to reverse them, so a move that happens tends to stay put. The smaller the coin, the thinner the book, and the less it takes to send the price somewhere it has no business staying. Size and liquidity do most of the explaining. Everything past that is speculation, and speculation is not what the tape recorded.
What a Spiking Micro-Cap Is Actually Telling You
Here is the honest read of all this. A large or mid-cap making an unusual move carried through better than nine times in ten. A micro-cap making the same-looking move failed to hold roughly one time in six. Same green candle on your screen, wildly different odds of it meaning anything by tomorrow.
The chart does not tell you which camp any single coin falls into. It never does in the moment. What the data offers instead is base rates, the background frequency of how these moves tend to resolve depending on how big the coin is. A spike in a tiny coin is not doomed. It is simply operating in a band where reversals show up almost three times as often as they do at the top.
Notice, too, where the volume lives. The micro band held more flagged moves than the other three combined. Most of the excitement in this market happens exactly where the ground is least stable. That is not a warning. It is just the geography.
How the Count Was Kept
The method is deliberately dull, which is the highest compliment you can pay a dataset. Every figure here comes from unusual moves flagged automatically, no hand-picking, no hindsight. Each flagged move was then checked against the real market price one day later to see whether it held or reversed. No modeling, no adjustments, no clever assumptions doing quiet work behind the scenes. A move either stood up a day on or it did not.
Run that process across 3,140 moves since June 5, and 384 of them failed the test. Sort the survivors and casualties by coin size and the ladder appears on its own: 5.5, 5.7, then a leap to 12, then 16.
The gap between the top of that ladder and the bottom is the whole story. In this market, how much a coin weighs quietly decides how much its sudden moves are worth believing.