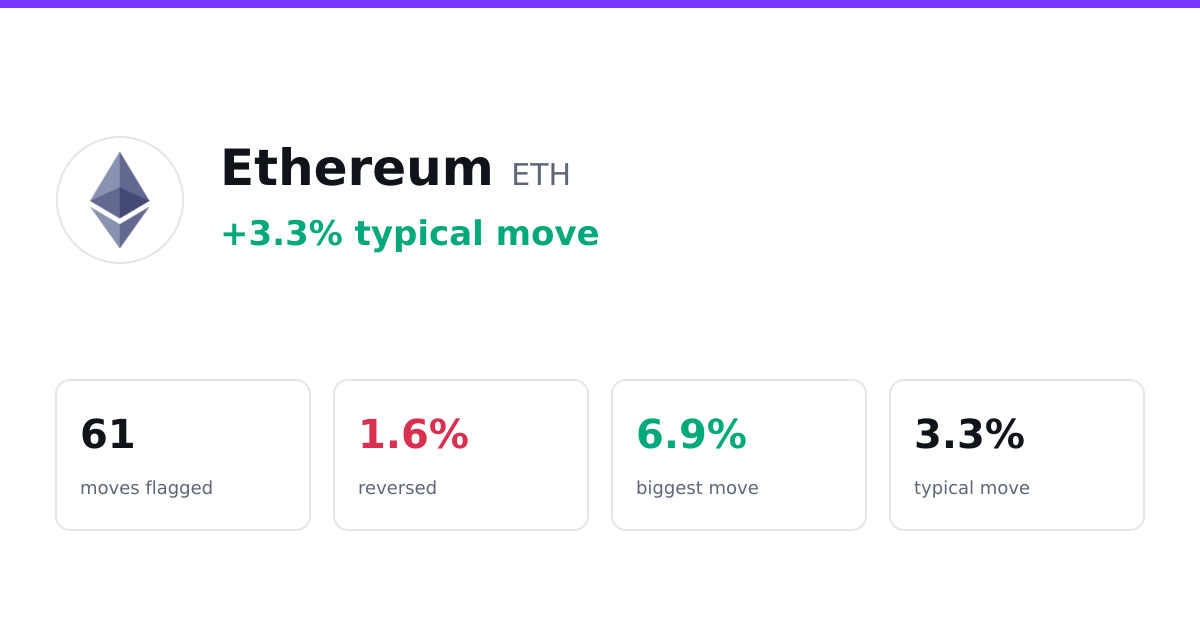
Ethereum (ETH) Price Moves: 61 Flagged, 1 Reversed
The Alarm That Kept Being Right
Picture the kind of move that trips a wire. Ethereum crosses some threshold, the system flags it, and the clock starts ticking on whether that move means anything. Between June 5 and November 10, 2026, that wire tripped sixty-one times. And here is the number that makes you lean in: only one of those sixty-one moves reversed the next day.
*Previously: Ethereum Faked a Breakout and Took the Stairs Back Down*
Sixty-one flags. One turnaround. That is a batting average most coins never get anywhere near.
If you spend your days out at the low-cap edge of the market, where a chart can go vertical at lunch and hollow out by dinner, Ethereum's record reads almost suspiciously calm. The moves showed up, got flagged, and then mostly did what they said they were going to do. No bait, no switch. Just a large coin behaving like a large coin.
Moves Built for Walking, Not Sprinting
The size of these moves is the first thing worth sitting with. The typical flagged move came in at 3.3%. The biggest one across the entire five-month stretch was 6.9%.
Read that again. The single most dramatic thing Ethereum did in roughly five months of flagged activity was a 6.9% move. For a micro-cap, 6.9% is a slow Tuesday. For an asset this size, it is a genuine event, the kind that gets the alarm ringing in the first place. Scale changes everything about what counts as unusual.
And the direction split is almost comically even. Of the sixty-one flagged moves, thirty-one were rallies and thirty were sell-offs. One apart. If you were trying to design a coin that pushed up exactly as often as it pulled down over a long stretch, you would struggle to do it this cleanly by accident. There is no directional bias hiding in this record. Ethereum went up, Ethereum came down, and it did both in near-equal measure, each time within a band that rarely strayed far from that 3.3% center of gravity.
Big coin, modest swings, balanced in both directions. That is the shape of it.
When Almost Nothing Reverses
Here is where the numbers stop being merely tidy and start being interesting.
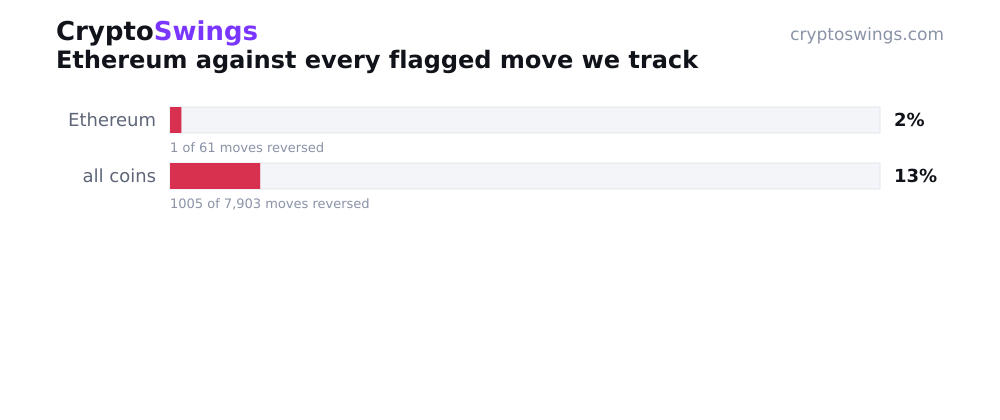
Across every coin tracked, the reversal rate sits at 12.7%. That is the baseline, the rate at which a flagged move tends to unwind the following day when you pool everything together. Call it the market's general tendency to take back what it just gave.
Ethereum's reversal rate is 1.6%.
That is not a small edge over the field. That is a different order of behavior. Where the average flagged move has better than a one-in-eight chance of flipping on itself within a day, an Ethereum move that got flagged almost never did. Sixty times out of sixty-one, the move stuck. The direction it chose at the moment of the flag was, overwhelmingly, the direction it held.
There is a plain reading here, and it is the one the data supports. A coin this large does not get shoved around by a single eager buyer or a lone nervous seller. When ETH makes a move big enough to trip the wire, something broad is usually behind it, and broad moves are harder to walk back by the next day. The flagged move isn't a blip dressed up as a trend. More often than not, it is the real thing.
What Actually Got Counted
A word on how any of this is measured, because the word "unusual" is doing a lot of work and deserves to be defined.
Every figure here comes from moves that were flagged automatically. The system watches price, and when a move stands out sharply enough from the coin's normal behavior, it gets marked as unusual. Nothing is cherry-picked by hand and nothing is included because it looked good in hindsight. The flag fires on the move, not on the outcome.
Then comes the part that gives the record its spine. For each flagged move, the outcome is checked against the real market price one day later. Did the move hold its direction, or did it reverse? That is the entire test. Hold or flip, measured against actual price, a day on. No interpretation, no mood, just where the number sat when the dust settled.
So when we say sixty of sixty-one moves held and one reversed, that is sixty-one specific events, each graded the same way, against the same clock. The reversal rate of 1.6% is just that single flip expressed as a share of the whole set.
So, Are Ethereum's Price Moves Reliable?
If the question you typed was something like *are Ethereum's flagged price moves reliable*, here is the direct answer: over this sample they were about as reliable as anything in the dataset, reversing just 1.6% of the time against an all-coin average of 12.7%.
In plain terms, when Ethereum tripped the alarm, the move that followed almost always meant what it appeared to mean the next day. One flip out of sixty-one flags is as close to "the move was real" as this kind of record gets. A rally that got flagged tended to still be a rally a day later. A sell-off that got flagged tended to still be a sell-off. The surprise, if there is one, is how little surprise there was.
That reliability lives alongside those modest sizes, which matters. Ethereum did not reward you with fireworks. Its biggest flagged move was 6.9%, and the typical one was half that. What it offered instead was follow-through. The moves were small by the standards of the chaotic corners of the market, but they were honest about which way they were headed.
The Part the Numbers Can't Do
Now the honest caveats, because a record is not a crystal ball and pretending otherwise is how people get hurt.
This is a study of what already happened. Sixty-one flagged moves between June 5 and November 10, 2026, each graded one day later. That is history, cleanly measured, and nothing more. It does not tell you what Ethereum will do tomorrow, next week, or the next time the wire trips. A 1.6% reversal rate across this window is a description of a past stretch, not a promise about the next one.
The window is fixed, too. Five months and change is a real sample, but it is a specific slice of market conditions. A different stretch, with a different backdrop, could produce a different rate. The record is what it is precisely because of when it was taken.
And there is a structural limit worth naming. A rate like this is only meaningful when there are enough cases behind it. Sixty-one flagged moves is a solid pile to work from, which is part of why Ethereum's number carries weight. Thinner samples, the kind where a coin only tripped the wire a handful of times, don't support the same confidence and get set aside rather than dressed up as signal. Here, the sixty-one is doing honest work.
What would change the picture? More time, mostly. A longer stretch, a rougher patch of market, a burst of flagged moves that behaved unlike these sixty-one. Any of that would redraw the lines. Until then, the record stands on its own modest, balanced, remarkably follow-through-heavy terms.
Sixty-one times the alarm went off, and sixty times the move was telling the truth. For a market that so often runs on misdirection, that is a rare thing to be able to say with a straight face.