How to Spot a Crypto Pump and Dump: What 6,727 Flagged Moves Reveal
Twice As Likely, And The Only Variable Was Size
If you want to know how to spot a crypto pump and dump before it folds on you, start with one number. Across 6,727 flagged moves tracked since June 5, 2026, the smallest coins reversed roughly twice as often as the largest ones. Same market, same kind of sudden candle, two very different endings depending on one thing: how big the coin was.
That is the whole study in a sentence, and it is worth sitting with. Not the shape of the chart, not the time of day, not the size of the spike. Size of the coin. The tape treats a giant and a flyweight the same way in the moment the candle fires, but it does not treat them the same way the next morning.
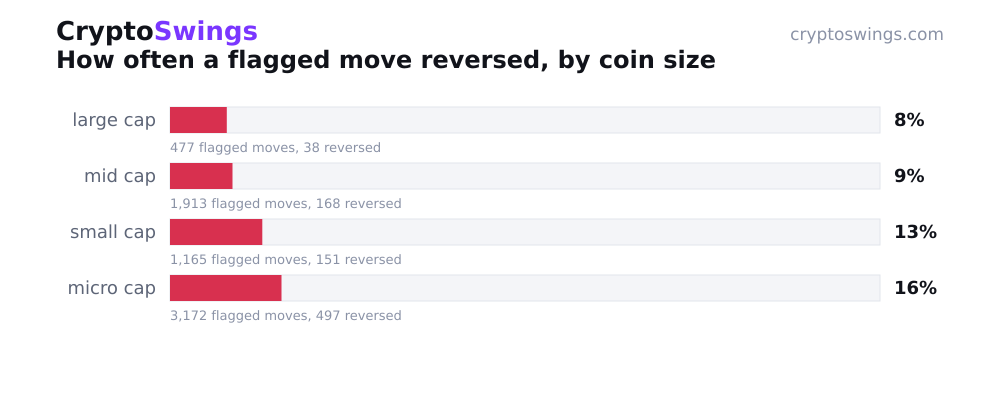
Of those 6,727 moves, 854 ended up reversed when measured against the real market price one day later. That is the headline pool. Everything below is just that pool sorted by weight class, and the weight class turns out to matter a great deal.
Four Weight Classes, Four Different Endings
Line the four size bands up in order and the slope is impossible to miss.
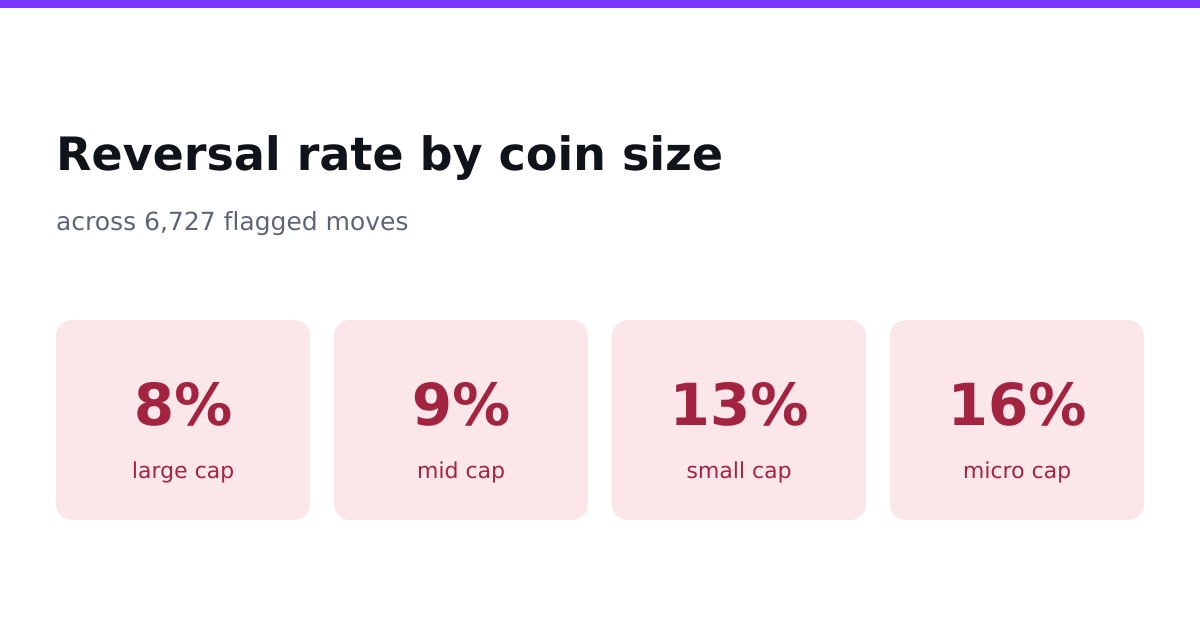
The large coins are the steady veterans. Across 477 flagged moves, only 38 reversed, a rate of 8 percent. Put the other way, 92 percent of the time a big-coin move was still standing a day later. When a heavyweight jumps, it mostly means it.
The mid-caps barely move the needle. Out of 1,913 moves, 168 reversed, a rate of 8.8 percent. That is the largest single sample in the study, and it lands almost exactly where the large coins did. Up through the mid tier, the floor holds firm.
Then the ground starts to tilt. The small coins put up 1,165 flagged moves, of which 151 reversed, a rate of 13 percent. Nothing catastrophic, but noticeably softer than the tiers above it. The held rate drops to 87 percent, and you can feel the deck getting less solid under your feet.
And then the micro-caps, which supply nearly half the entire dataset: 3,172 moves, the biggest bucket of the four, with 497 reversals. That works out to 15.7 percent, the highest reversal rate in the study. Roughly one in six micro-cap moves had unwound by the next day.
Stack the extremes and that is where the two-times figure comes from. Eight percent at the top, 15.7 at the bottom. The explanation the data supports is the dull, correct one: liquidity and size. A large coin has the depth to absorb a surge and keep it. A micro-cap is a thin pool, easy to splash, and just as easy to drain. No deeper motive required. The small ones are small, and small is fragile.
What A Spiking Micro-Cap Is Actually Telling You
So you are watching a tiny coin rip upward and the only honest question is: what does the record say happens to moves like this?
The record says most of them hold. Even in the shakiest tier, 84.3 percent of micro-cap moves were still intact a day later. The spike is not automatically a trap, and anyone telling you every micro-cap pop is doomed is arguing with the numbers.
But the record also says the odds of a reversal nearly double as you walk down from the giants to the flyweights. The size of the coin is doing more work than the drama of the candle. A violent green bar on a heavyweight and a violent green bar on a micro-cap look identical in the moment and behave differently by morning, and the difference is baked into the coin before the candle ever prints.
That is the practical read. When a small coin spikes, you are not looking at a different kind of move. You are looking at the same kind of move in a tier where it is measurably more likely to come apart. The chart does not change. The ground under it does.
How The Numbers Were Gathered
None of this came from cherry-picking. Every figure here comes from moves that were flagged automatically the moment they went unusual, with no human deciding after the fact which ones counted. The flag goes up when a coin does something out of the ordinary, full stop.
Then the outcome gets measured against the real market price one day later. Not a projected price, not a theoretical one, the actual price the market was quoting after the move had time to breathe. If the move was still there, it held. If it had given itself back, it reversed. Same yardstick for the heavyweight and the flyweight, 6,727 times, which is the only reason the tiers can be compared at all.
That consistency is the point. The reversal rates differ across size bands because the coins differ, not because the measuring stick moved.
How To Spot A Crypto Pump And Dump In The Data
Here is the question as a person actually types it: how to spot a crypto pump and dump? The most useful single answer this data offers is that the reversal rate climbs steadily as coins get smaller, topping out at 15.7 percent in the micro-cap tier against 8 percent for the largest coins.
In plain terms, a sudden spike is most likely to reverse exactly where the coin is smallest and thinnest. That is where the detected pump-and-dump pattern lives. The move that fires and then evaporates by the next day shows up far more often at the bottom of the size ladder than the top, and the gap between the two ends is about twofold.
What that gives you is a weighting, not a verdict. A micro-cap spike is not a guarantee of anything, because most of them still held. But the same candle carries a higher reversal rate the smaller the coin gets, and the data is unusually clean on that one point. If you are trying to read a spike, the coin's size is a piece of context worth more than the spike's drama. This is observed frequency, measured the same way every time, and it is the part of the picture the numbers can actually stand behind.
The dump, when it comes, likes thin water. That is the shape in the data, and it is consistent enough across 6,727 cases to take seriously.
What This Record Can And Cannot Do
Now the fine print, because this data has edges and pretending it does not would be dishonest.
This is a record of what happened, not a forecast of what will. It tells you how often moves of each size reversed across thousands of past cases. It does not tell you what the next micro-cap spike will do. A 15.7 percent reversal rate means roughly one in six of these moves came apart by the next morning across the whole sample, and nothing in it points a finger at which one in six.
The measurement window is also fixed. Everything here is judged at one day later, no sooner and no later. A move counted as held might have wobbled an hour afterward, and a move counted as reversed might have come roaring back the following week. The study only knows the snapshot it took, and the snapshot is taken at a single point.
And the tiers here are the ones that had enough cases to mean something. Thinly populated buckets were left out on purpose, because a handful of moves can swing a percentage into nonsense. The four bands that survived are the ones carrying real weight, from 477 moves at the smallest tier to 3,172 at the largest.
What would change the picture? A longer measurement window. A different market stretch, calmer or wilder than the one since June 5. More data in the corners that got trimmed. Any of those could nudge the numbers.
But the core finding is the kind that tends to hold its shape: the smaller the coin, the more often its big candle took the money and ran. Eight percent at the top, 15.7 at the bottom, measured the same way 6,727 times. The spike is loud everywhere. It is just quicker to vanish where the water is shallow.