Mantle (MNT) Price Moves: 63 Flagged, 4 Reversed
Sixty-Three Alarms, Four Takebacks
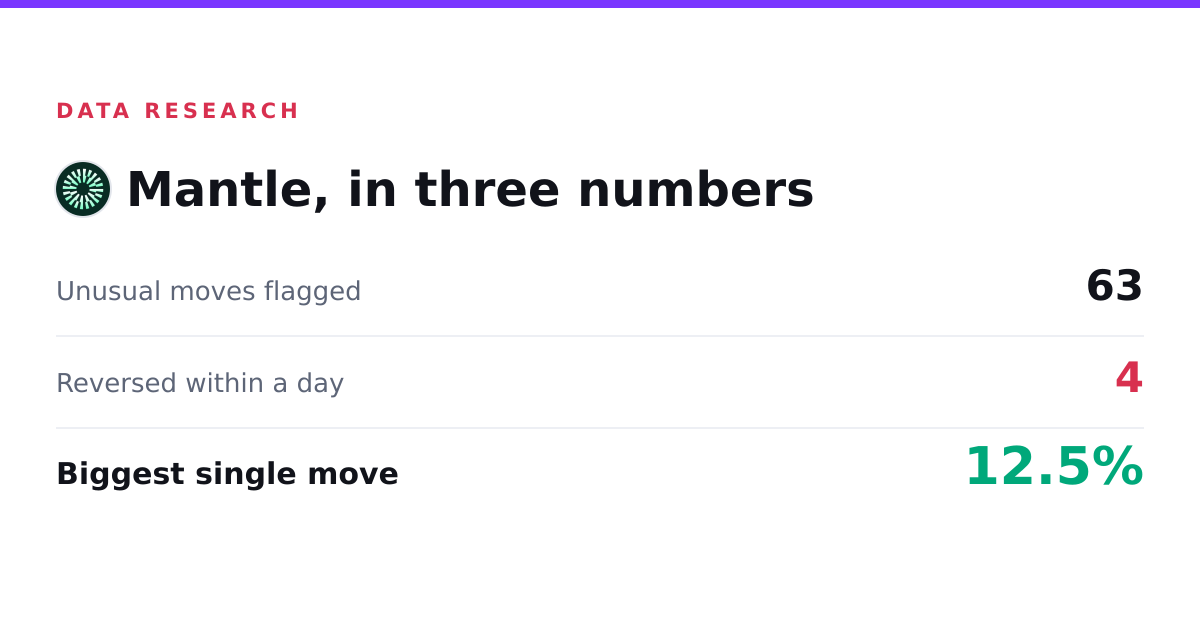
Start on November 18, 2026, the most recent time Mantle tripped the wire. By then the tally stretched back to June 9, and the full record reads like this: sixty-three unusual moves flagged over roughly five months, and only four of them reversed within a day.
*Previously: Mantle Pumps, Dumps, and Somehow Ends the Day Up 2.9%*
That is the whole shape of it in one line. A coin that moved sharply dozens of times and almost always meant it.
Sixty-three is a lot of flags for one ticker. What makes MNT worth a closer look is not the count. It is how rarely those moves turned around afterward.
What a Typical Mantle Move Looks Like
Mantle is not a coin that goes vertical at lunch. Its unusual moves run modest by the standards of the market's wilder corners. The typical flagged move was about 4.7 percent, a real jolt, enough to register, but nothing that looks like a cliff on the chart.
Even the biggest one stayed measured. The largest move across the whole stretch was 12.5 percent. That is the ceiling here, and by micro-cap standards it barely qualifies as drama. No triple-digit spikes, no candle that needs its own paragraph. Mantle moves the way a mid-sized coin moves, with intent, not with fireworks.
The direction split is close to even, with a slight lean toward the downside. Of the sixty-three flagged moves, twenty-eight were rallies and thirty-five were sell-offs. So the alarm went off a little more often on the way down than on the way up, but not dramatically so. If you squint, it is a coin that spent five months roughly balanced, tipping its weight toward red just slightly more than green.
Hold onto those three numbers - 4.7 percent typical, 12.5 percent at the extreme, a near-even split, because they describe a coin with a steady temperament. The interesting part is what happened to those moves after they landed.
The Part That Stands Out
Here is where Mantle separates itself from the pack.
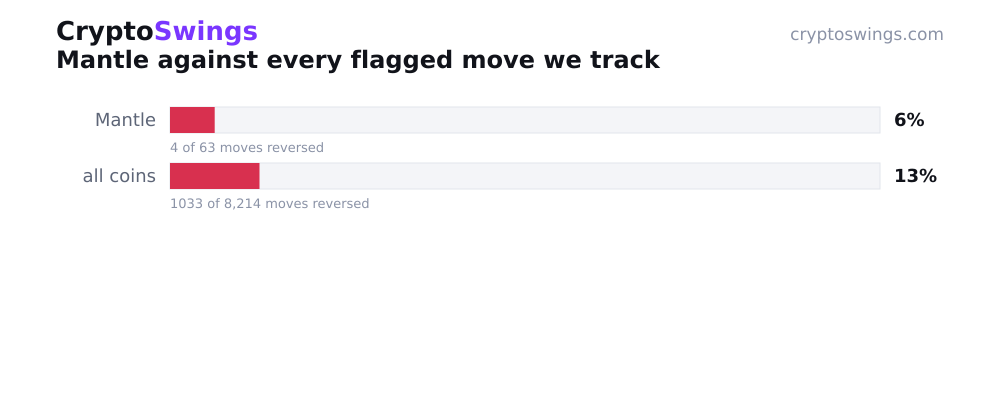
Across every coin tracked, the reversal rate, the share of unusual moves that unwind within a day, sits at 12.6 percent. Call that the house baseline. Flag a sharp move on a random coin, and a little better than one in eight of them give it back by the next day.
Mantle came in at 6.3 percent. Exactly half the baseline.
Four reversals out of sixty-three is the behavior of a coin that mostly means what it does. When MNT moved, the move tended to stick. The spike held, the drop held, and the next day's price looked more like a continuation than a correction. In a market built largely out of head-fakes and takebacks, that is a genuinely unusual signature, not because the moves were big, but because they were durable.
A coin with Mantle's profile doesn't lure you in and then quietly reverse. The sample is clear on that: when sixty-three moves produced only four about-faces, the pattern is persistence, not whiplash.
How a Move Earns a Flag
Worth being precise about what is being measured, because the numbers only mean something if the rules behind them are clean.
An unusual move here is one the system flags automatically, a price jump or drop large enough to stand out from Mantle's ordinary chop. No human decided after the fact that a move looked interesting. The threshold did the flagging, consistently, every time, across all sixty-three instances.
Then comes the only question that matters: did it hold? The outcome is checked against the real market price one day later. If the move faded or snapped back, it counts as a reversal. If the new level roughly stuck, it counts as holding. That is the entire test, a flag, then a check against the tape a day on. No interpretation, no cherry-picking, just what the price actually did next.
By that measure, Mantle held fifty-nine times and reversed four.
So, Does Mantle Follow Through on Its Moves?
If you came here asking whether Mantle's sharp moves tend to stick or snap back, the answer is that they stick, the reversal rate sits at 6.3 percent, half the 12.6 percent averaged across all tracked coins.
That is the direct read. Over sixty-three flagged moves spanning June to November, only four unwound within a day. Everything else more or less stayed put. For a coin whose moves run modest in size, a 4.7 percent typical jolt, a 12.5 percent extreme, that durability is the defining trait. Mantle doesn't move often enough to be called violent, but when it does move, the move earns its keep.
The practical shape of it: a slight tilt toward sell-offs, moves that rarely exceed low double digits, and a strong tendency to hold whatever ground they take. That is not a dramatic portrait. It is a consistent one, which in this market is almost more interesting.
What These Numbers Can't Tell You
Now the honest part, because a record of what happened is not a map of what's coming.
This is a backward-looking study. It tells you that across sixty-three flagged moves, Mantle reversed four of them within a day. It does not tell you what the sixty-fourth move will do. A low reversal rate describes a tendency that showed up over five months, it is not a guarantee, and nothing about past persistence binds the next candle to behave the same way.
The window is fixed, too. Everything here lives between June 9 and November 18, 2026. Shift the start or end date and the picture could shade differently, a quieter stretch, a rougher one, a different balance of rallies and sell-offs. Five months is a real sample, but it is a specific slice of time, not the whole life of the coin.
There is also the question of what "one day later" captures and what it misses. The outcome is measured against the price a single day after the flag. A move that held for a day and then unraveled a week later still counts as holding here. The test is clean, but it is narrow by design, and it says nothing about what happens further down the line.
And the counts matter. Twenty-eight rallies and thirty-five sell-offs is a workable split, but any finer slicing, carving the data into ever-smaller buckets, runs into thin samples fast, and a handful of cases can't carry a conclusion. Where there aren't enough instances to say something meaningful, the honest move is to not say it. Four reversals is a clear signal against sixty-three moves. Four reversals split across a dozen sub-categories would be noise.
What would change the picture? More time, mostly. A longer record, a stretch of genuine volatility, a run where Mantle's moves started unwinding the way the broader market's tend to, any of those would be worth re-measuring against. For now, the record says what it says: sixty-three moves, four reversals, a coin that has spent five months mostly meaning what it does. That is the tendency as logged by CryptoSwings, and tendencies, unlike the next candle, are the only thing data can honestly describe.
Mantle's number to carry out of all this is 6.3 against a baseline of 12.6. Half the market's reversal rate, over a real stretch of time, on a coin that never needed a vertical candle to make the point. In a corner of the market defined by moves that don't last, a coin whose moves mostly do is the kind of outlier worth noticing, even if the chart never once looked exciting while doing it.