Solana (SOL) Price Moves: 39 Flagged, 1 Reversed
There is a particular kind of coin that gets talked about like weather. Solana is one of them. Loud on the good days, blamed on the bad ones, always somewhere in the conversation. So it is a small pleasure to look at its actual price record and find something almost boring in the best possible sense.
*Previously: Solana Behaved, XYO Didn't, And Traders Guessed Wrong*
Thirty-Nine Moves, One Undone
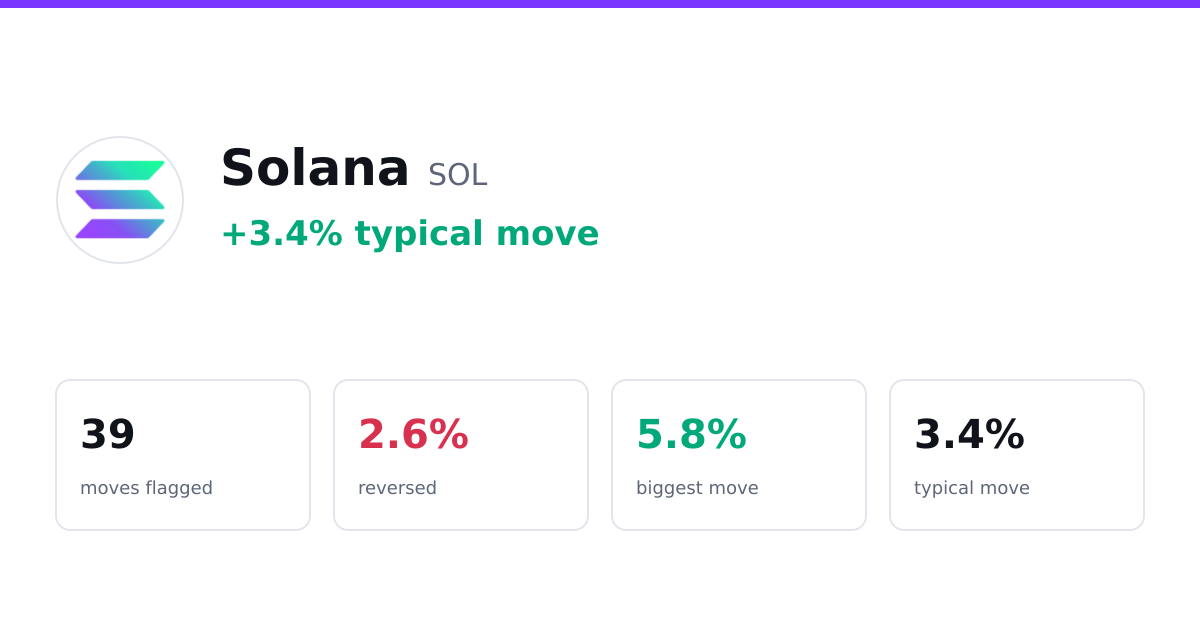
Here is the whole story in a sentence: between June 5 and September 3, 2026, Solana set off 39 unusual price moves, and exactly one of them reversed within a day.
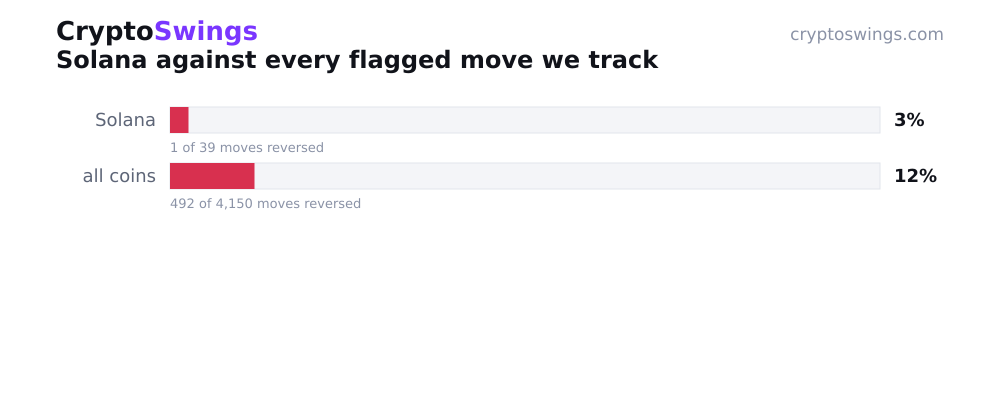
That is a reversal rate of 2.6%. Thirty-nine chances to fake everyone out, and Solana blinked exactly once.
Most of the coins that trip these flags do something dramatic on the way up and then quietly hand it all back. Solana, over this stretch, mostly meant what it did. When it moved, it stayed moved.
Small Steps, Not Big Leaps
The size of these moves is the other half of why the record reads so steadily.
The typical flagged move for Solana came in around 3.4%. The biggest one across the whole three months was 5.8%. For a coin that carries a reputation for volatility, that is a surprisingly modest ceiling. Nothing here looks like a data glitch. Nothing here needs you to check the axis. These are the moves of a heavyweight shifting its weight, not a micro-cap doing gymnastics.
The direction split was almost even, tilted slightly to the upside. Of the 39 flags, 22 were rallies and 17 were sell-offs. So this was not a coin melting up on hype or bleeding out in a slow leak. It leaned green, but only just, and it did both without much theater.
Put the size and the direction together and you get the profile of a coin that moves often enough to keep appearing on the radar, but rarely moves so far that it has to give any of it back. The moves were real. Modest, but real.
What A Steady Record Looks Like From The Outside
Now the comparison that makes the number worth writing about.
Across every coin tracked over this period, the average reversal rate sits at 11.9%. That is the baseline. Roughly one in eight unusual moves, market-wide, comes undone a day later.
Solana came in at 2.6%. That is well under a quarter of the typical rate.
The gap is the point. Plenty of coins flash a big number and then spend the next day pretending it never happened. Solana, at least over this window, was not in that habit. When it set off a flag, the odds that the move held up were far better than what you would expect from a coin picked at random off the board.
It helps that its moves were small to begin with. A 3.4% shift does not have far to fall back before it settles, and a ceiling of 5.8% means there was never a towering spike begging to be given back. Size and stability tend to travel together, and Solana had both. This is a large, heavily traded asset behaving like one.
How A Move Earns The Word "Unusual"
Worth being clear about what is actually being measured here, because the numbers only mean something if the definitions are tight.
An unusual move is flagged automatically. The system watches for price action that stands out from a coin's normal behavior, and when something crosses that line, it gets logged as a move. No human is sitting there deciding which candles feel interesting. The flag is mechanical.
The outcome is measured against the real market price one day later. That is the whole test. If a coin spikes and the gain is still there a day on, the move held. If the price has snapped back toward where it started, the move reversed. Simple, and consistently applied across every coin, which is what makes the 11.9% baseline a fair yardstick.
So when we say Solana reversed one of 39 moves, we mean one move that looked significant when it fired had unwound by the time the next day's price was read. The other 38 were still standing.
Do Solana's Price Moves Reverse? Here Is The Direct Answer
If you came here asking whether Solana's price moves tend to reverse, the answer is: rarely. Over this three-month window, Solana reversed just 2.6% of its flagged moves, one out of 39.
That is the number, and it is worth sitting with because it runs against the reflex. The instinct with any coin this visible is to assume every spike is a setup and every drop is a shakeout. The record here does not support that reflex. The overwhelming majority of Solana's flagged moves, up and down alike, were still intact a day later.
It is a low reversal rate by any reading, and a low one against the market average especially. For the three months from June 5 to September 3, Solana's moves mostly went somewhere and stayed there.
What This Record Cannot Promise You
Now the part that keeps everyone honest.
This is a record of what already happened. It is not a forecast, it is not a signal, and it is not advice. Solana reversed 2.6% of its moves over this specific window, and that sentence is true only about that window. The next flagged move is its own coin toss, and nothing here bends the odds on it. A record is a rear-view mirror, not a headlight.
The window is also fixed. June 5 to September 3, 2026, and nothing outside it. Stretch the dates or shift them and the picture can move. A quieter three months might show even fewer reversals. A rougher stretch might loosen that tidy 2.6% considerably. The number is a snapshot, not a permanent trait carved into the coin.
There is a sample-size caveat too. Any comparison across coins leaves out the ones with too few flagged moves to say anything meaningful. A coin with a small handful of moves can post a reversal rate of zero or a hundred percent and neither figure would tell you much. The market-wide 11.9% baseline is built from coins with enough history to count. Solana's 39 flags clear that bar comfortably, which is part of why the comparison is worth making at all, but it is still one coin over one season.
And a low reversal rate is not the same as a promise of safety or a guarantee of gains. All it says is that when Solana moved, the move usually held its ground a day later. It says nothing about how big the next move will be, which direction it will point, or whether it will show up at all. The data records behavior. It does not predict it. Those are per-coin figures automatically flagged and tracked by CryptoSwings, and like any record of the past, they describe rather than foretell.
What would change this picture is simple to name: more time, a rougher market, a different mix of rallies and sell-offs than the roughly even split Solana ran here. Any of those could move the number. For now, the record stands as it is. Thirty-nine moves, one reversal, a coin that spent three months doing what it did and mostly keeping it.
For an asset that gets discussed like a storm system, that is a quietly steady chart. Not thrilling. Just consistent, which on most days is the harder thing to be.