Chainlink (LINK) Price Moves: 61 Flagged, 2 Reversed
Picture the radar lighting up on a slow afternoon. A big, familiar name posts a move sharp enough to trip the alarm, and the usual instinct kicks in: here comes the fade, the giveback, the quiet unwind once the first buyers cash out. With Chainlink, that instinct has been wrong almost every single time.
Sixty-One Alarms, Two Takebacks
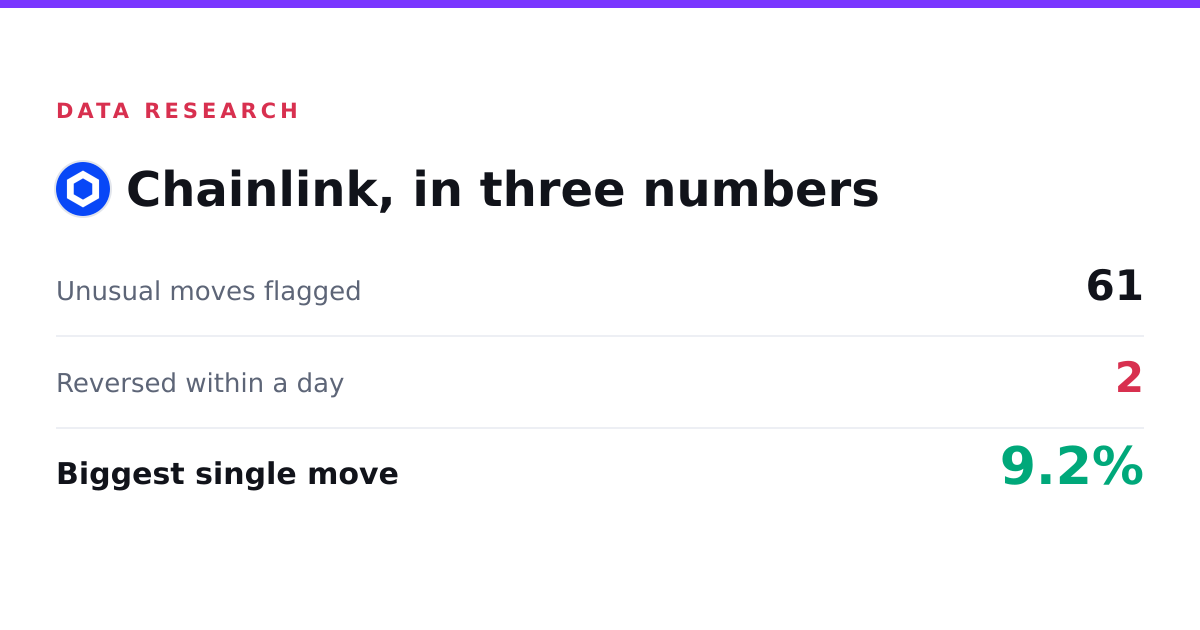
Over five months, LINK lit up the radar sixty-one times and reversed on exactly two of them.
That is the whole record in one line, and it is a strange one. From June 5 to November 1, 2026, Chainlink was flagged for sixty-one unusual moves. Two of those later unwound into confirmed reversals. The rest held their ground, which for a coin that trades as much as LINK is less common than you might expect.
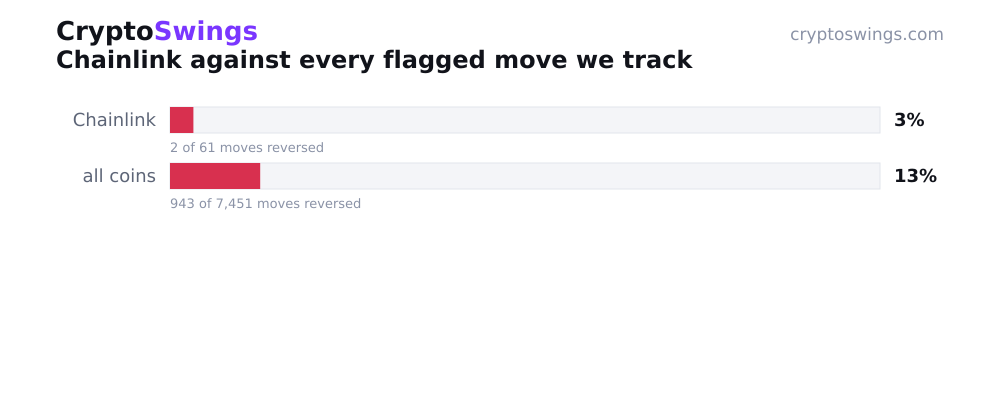
Two out of sixty-one works out to a reversal rate of 3.3 percent. Keep that number in your pocket. It does most of the heavy lifting in this story, and it only gets more interesting once you put it next to what other coins do.
The Shape of a Chainlink Move
Before the comparison, the texture. A typical flagged move for LINK ran about 4.5 percent. That is a real jolt but not a violent one, the kind of candle that gets noticed without triggering a panic. The biggest single move over the whole stretch was 9.2 percent, which is notable mostly for how restrained it is. Plenty of smaller coins clear that before lunch. Chainlink's ceiling, across five months of flagged activity, barely scraped into double digits.
The direction split is almost eerily even. Of the sixty-one moves, thirty-two were rallies and twenty-nine were sell-offs. That is close to a coin flip between up and down, which tells you LINK was not doing one thing all summer and autumn. It jumped. It dropped. It did both at a measured pace, and then, far more often than not, it kept whatever it had just done.
The sell-offs matter here as much as the rallies. A reversal is not only a rally that gives back its gains. It is also a drop that snaps back. Chainlink had twenty-nine sharp moves to the downside and the overwhelming majority of them did not bounce the way a knee-jerk trade would expect. When LINK went down, it mostly stayed down. When it went up, it mostly stayed up. Momentum, in other words, meant something.
*Previously: The Week Size Mattered More Than Momentum*
Why 3.3 Percent Is the Headline
Now the number that earns its place at the top.
Across every coin tracked, the baseline reversal rate sits at 12.7 percent. Roughly one unusual move in eight eventually unwinds. That is the ambient weather of the market, the rate of second thoughts you would expect from any random name posting a sharp candle.
Chainlink comes in at 3.3 percent. Call it a quarter of the baseline. Where the average coin reverses about one flagged move in eight, LINK reversed one in roughly thirty. For a large, heavily traded asset, that is the pattern you would hope to see and rarely get: moves that mean what they say, that do not evaporate the moment the first wave of sellers starts collecting.
None of this makes LINK's spikes free money, and it says nothing about where the price goes next. What it describes is persistence. When Chainlink moves, the move has a strong tendency to hold at least through the next day. That is not a promise the market made anyone. It is just what the record shows, over sixty-one chances to behave otherwise.
How a Move Earns the Label
Worth being precise about what is actually being counted, because the discipline is the whole point.
Every figure here comes from automatically flagged unusual moves. A price jump or drop crosses a threshold large enough to stand out from Chainlink's normal background noise, and the system marks it. From there, the outcome is not a matter of opinion or vibe. The flagged move is checked against the real market price one day later. If the move held, it held. If it unwound into a confirmed reversal, it counts as a reversal. No interpretation, no judgment calls, just the price then and the price a day on.
That is why the two reversals out of sixty-one are a clean figure rather than a guess. Each of those sixty-one moves got the same test. Two failed it. The other fifty-nine were still standing when the clock came around.
The even rally-versus-sell-off split falls out of the same process. Thirty-two upside flags, twenty-nine downside flags, each measured the same way against the following day's price. There is no thumb on the scale toward the moves that make a better story.
So Does Chainlink Hold Its Moves?
If you came here asking whether Chainlink holds its moves or fades them, here is the direct answer: it holds them, and it holds them hard. Over sixty-one flagged moves since June, only two reversed, a rate of 3.3 percent against a 12.7 percent baseline across all tracked coins.
That is about as emphatic as this kind of data gets. The coin that fades everything would sit well above the baseline. The coin that holds everything sits well below it. Chainlink sits well below it. When LINK spikes or slumps hard enough to trip the radar, the follow-through has been the rule and the takeback the rare exception.
It is a reputation that has to be earned candle by candle, and over five months, fifty-nine of sixty-one candles earned it.
What This Record Cannot Promise
Now the honest part, because a clean number invites overconfidence and overconfidence is how people get hurt.
This is a record of what happened, not a map of what comes next. Chainlink held fifty-nine of sixty-one flagged moves through the following day over one fixed stretch, June 5 to November 1, 2026. That is the window. It is closed. The sixty-second flagged move does not have to behave like the first sixty-one, and nothing in this data guarantees it will. A 3.3 percent historical reversal rate is a description of a past, not a floor under the future.
The window also decides the story. Pull the start date earlier or push the end later and the count shifts, the split shifts, maybe the rate shifts with them. Five months is enough to show a strong tendency. It is not enough to call it a law.
And a word on what gets left out. Buckets with too few cases to mean anything are set aside rather than dressed up as signal. Two reversals is a small number by design, which is the good news here, but it also means there is not much texture to read inside those two. Were they rallies or sell-offs, large or small? With only two, any pattern you think you see is mostly noise wearing a lab coat.
What would change the picture is simple to state. A run of flagged moves that suddenly fade where they used to hold would drag that 3.3 percent upward fast, and the record would start telling a different story. A longer calm stretch with more follow-through would push it the other way. The number is a snapshot of behavior, and behavior can turn.
For now, though, the snapshot is unusually crisp. Sixty-one alarms. Fifty-nine that stuck. One of the busiest names on the board turning out to be one of the steadiest about meaning what it does. In a market that fades roughly one sharp move in eight, Chainlink has been faded about one in thirty, and that gap is the entire point.