How to Spot Pump and Dump Crypto: What 3,145 Flagged Moves Show
The Candle That Couldn't Stay Put
A big green spike lands on the chart, the kind that makes you sit up, and one day later it has quietly handed most of its winnings back to the market. That scene repeats often enough that a reader looking up how to spot a pump and dump in crypto really wants one thing: does the size of the move tell you anything about whether it sticks?
Across 3,145 automatically flagged unusual moves, it does. And the pattern points in exactly the direction that ruins the fun.
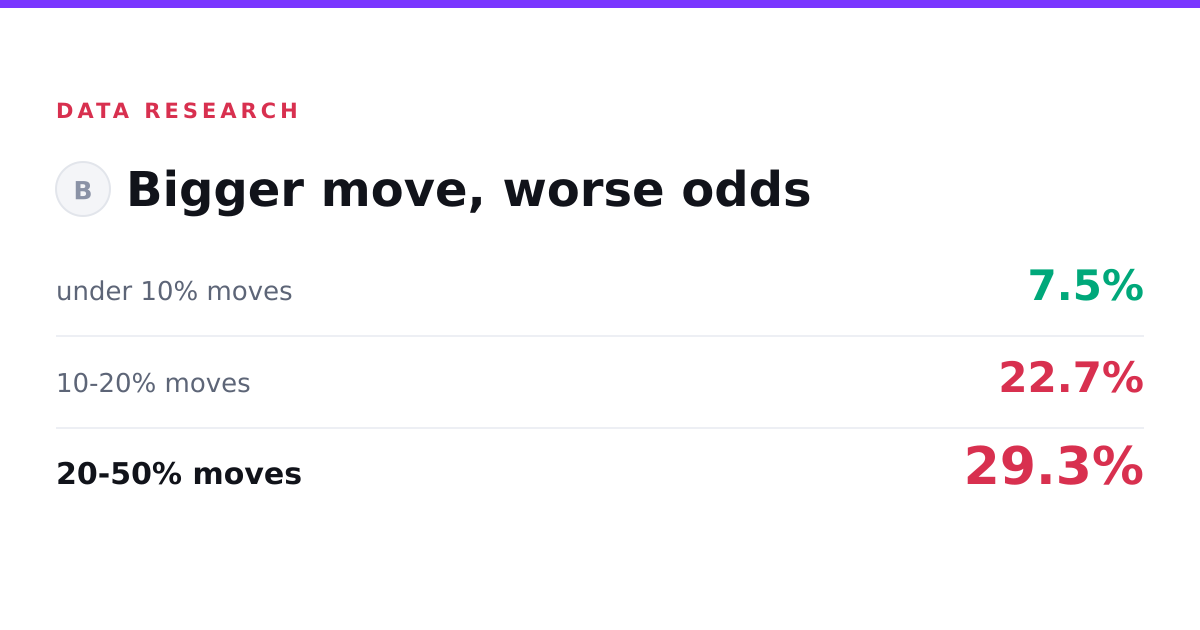
The smallest moves on the board, the ones under 10 percent, held their ground. Out of 2,286 of them, only 172 reversed within a day. That is a reversal rate of 7.5 percent. Better than nine in ten stayed put.
Now climb to the top of the range. Among moves of 20 to 50 percent, there were 225 in the sample, and 66 of them round-tripped. That is a 29.3 percent reversal rate. Roughly one in every three of the loudest moves gave the excitement straight back.
Same market, same measuring stick. The only variable that changed was how dramatic the move looked when it printed. The louder the candle, the shorter its memory.
Three Bands, One Trend Line
Line the size bands up and the slope is hard to miss. These are observed frequencies, mind you, not forecasts. Nothing here predicts what any single coin does next. It is a tally of what already happened.
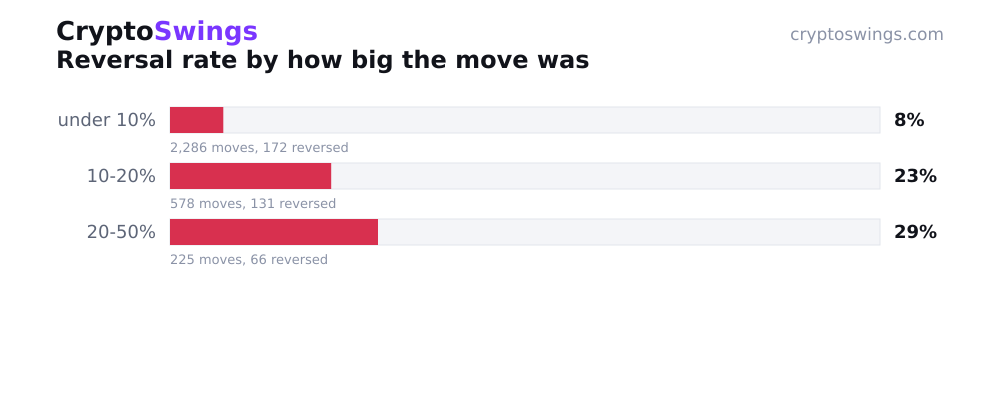
Start small. The under-10-percent band held 2,286 moves and reversed 172 times, a 7.5 percent reversal rate. In plain terms, 92.5 percent of these quiet movers were still standing a day later. Modest moves tend to be honest ones.
Step up to the 10-to-20-percent band. There were 578 moves here, and 131 of them turned around within a day. That is a 22.7 percent reversal rate, better than triple the small-move number. The market is already treating a move of this size with more suspicion, and often for good reason.
Then the big one. The 20-to-50-percent band, 225 moves, 66 reversals, a 29.3 percent reversal rate. Roughly one in three unwound. The other 70.7 percent held, so a large spike is not doomed. But it carries far more baggage than a gentle one.
Read top to bottom and the story writes itself. Every step up in size buys a step up in the odds of a round trip. From 7.5 to 22.7 to 29.3 percent, no reversals in the trend. The move that shouts is the move that most often takes it back.
What a Big Spike Is Actually Telling You
So what does this do for someone staring at a 30 percent candle in real time?
It does not tell you that candle is a fake. Most large moves in this data held. What it tells you is the base rate you are standing on. A move of that size sits in a group where nearly one in three did not survive the day. A quiet move sits in a group where the failures are rare exceptions.
That is context, not a verdict. Think of it like weather. Knowing that a certain kind of afternoon often ends in rain does not mean today's sky is lying to you. It means you glance at the clouds before you leave the umbrella at home. The size of a spike is one of those clouds. Bigger moves come with worse historical follow-through, and knowing which band a move falls into changes how much of the story you should assume you already have.
The trap, if there is one, is treating a large green candle as its own confirmation. The data says the opposite: the more spectacular the print, the more often it was the whole event rather than the start of one.
How the Outcomes Were Counted
Worth being clear about the measuring, because it is simple and it matters.
Every figure here comes from automatically flagged unusual moves, each one checked against the real market price one day later. A move that was still holding its gain counts as held. A move that had unwound counts as a reversal. No interpretation, no judgment calls, just where the price actually sat when the day was up.
The bands are cuts by size: under 10 percent, 10 to 20 percent, 20 to 50 percent. Bands too thin to say anything meaningful were left out rather than dressed up, so what you are reading is the part of the sample large enough to carry weight. Even the smallest band shown holds 225 moves, and the largest holds 2,286. That is a real spread of behaviour, not a handful of anecdotes.
How to Spot a Pump and Dump in Crypto, Answered Directly
The question people actually type is some version of: how do you spot a pump and dump in crypto before it dumps? Here is the straight answer this data supports.
Watch the size of the move. Across 3,145 flagged moves, the largest band, spikes of 20 to 50 percent, reversed within a day 29.3 percent of the time, while the smallest band, under 10 percent, reversed just 7.5 percent of the time. The bigger the pop, the more often it round-tripped. That is the single cleanest signal in the whole dataset.
None of this is a guarantee that a given spike will fall. Most large moves in the sample still held. But the odds of a round trip climb steadily as the move gets bigger, and that relationship is the closest thing here to a rule of thumb. If you want one number to remember, remember that a large spike reversed roughly four times as often as a small one.
The frequencies came from CryptoSwings, which flags unusual price moves and logs where each one lands a day later, and the size trend runs clean through all three bands with no exceptions. Small moves are the quiet, reliable end of the market. Large moves are where the round trips cluster.
What This Record Can't Tell You
Now the honest part, because a number this tidy can flatter itself if you let it.
This is a record of what happened, not a forecast of what will. These are observed frequencies over a fixed set of flagged moves, checked one day later, and nothing about them promises the next 30 percent spike behaves like the last hundred. A 29.3 percent reversal rate means 29.3 percent of those particular moves reversed. It does not mean any single move carries those exact odds tomorrow.
The window is fixed too. Every outcome was measured one day out. A move that held for a day and unwound on the second day counts here as held, because the second day is outside what this data looks at. Stretch the clock and the numbers would shift, possibly a lot. This is a one-day snapshot, nothing longer.
And the bands are only the ones with enough cases to count. Thinner slices were excluded rather than reported on faith, which keeps the figures honest but also means the very largest, rarest moves are not represented here. The picture would change with a different window, a larger sample, or a different way of drawing the size lines.
What survives all of that is the shape, and the shape is stubborn. Small moves held better than nine times out of ten. Large moves round-tripped nearly a third of the time. Between those two ends, the reversal rate only ever climbed. The market keeps its calmest moves and quarrels most with its loudest, and that, at least, this data shows plainly.