Crypto Pump and Dump Rates by Coin Size: 3,141 Moves Analyzed
The Gap Nobody Talks About Out Loud
Everyone in crypto already suspects small coins are twitchier. Fewer people have bothered to put a number on exactly how much twitchier. Here it is: across 3,141 flagged moves tracked since June 5, 2026, a suspicious spike in the smallest coins reversed nearly three times as often as one in the largest. Precisely 2.9 times, if you want to carry the decimal.
That is the whole headline, really. But the interesting part is how neatly the pattern lines up when you sort by size, because markets rarely give you anything this clean.
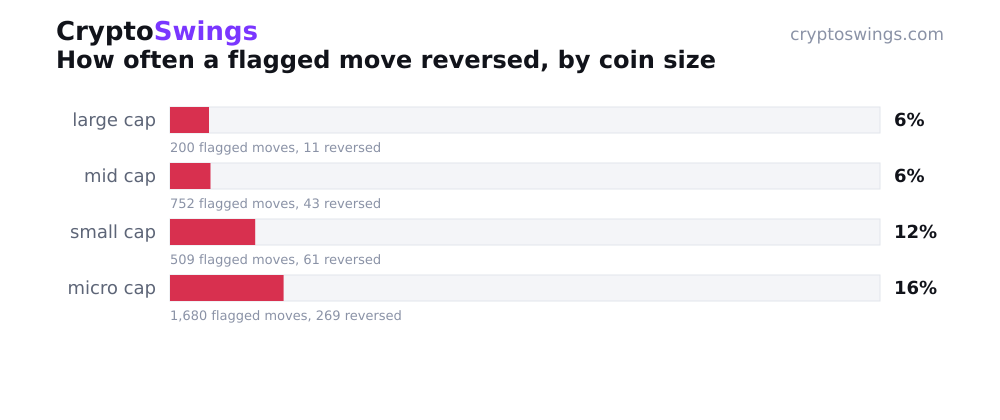
Of all 3,141 moves, 384 ended up reversing, meaning the spike did not survive to the next day. That baseline sounds modest until you break it apart by weight class. Then the average stops being useful and the story starts.
Four Weight Classes, One Very Clear Trend
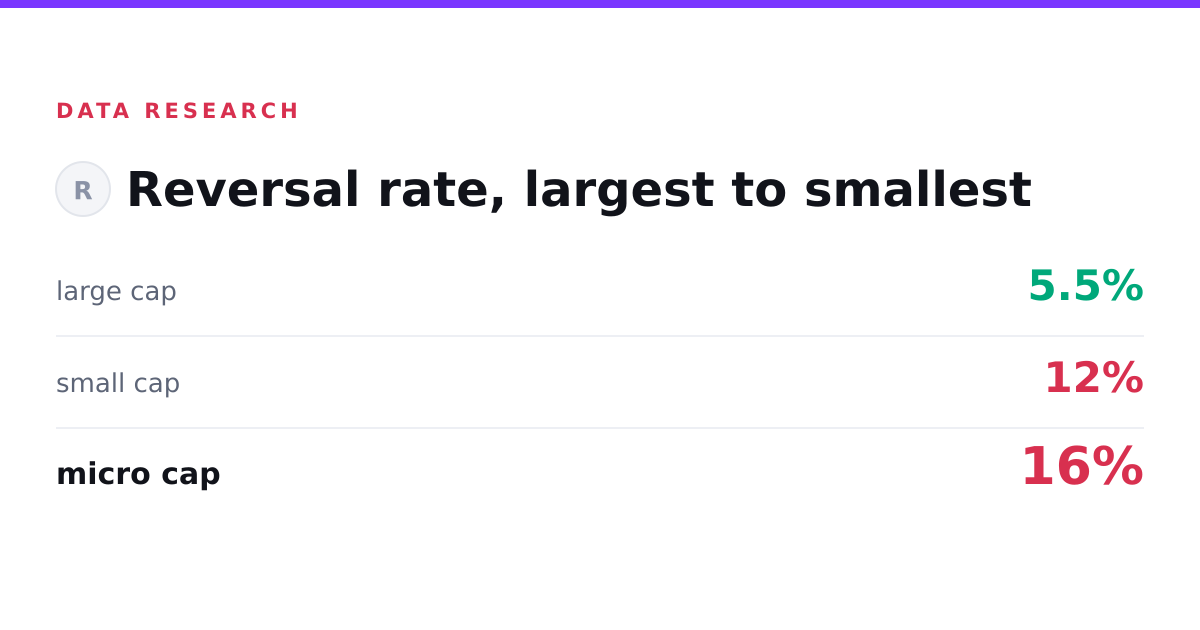
Start at the top. Among the large-cap coins, 200 flagged moves came through, and 11 of them reversed. That is a 5.5 percent reversal rate. Put differently, when a big coin made an unusual move, it held its ground the next day about 94.5 percent of the time. Boring. Boring is the point.
The mid-caps behaved almost identically. Out of 752 flagged moves, the second-largest sample in the study - 43 reversed, for a 5.7 percent rate. So the top two tiers, despite one being nearly four times the size of the other by move count, land within two-tenths of a percentage point of each other. If you were expecting a gentle slope, the first two steps are basically flat.
Then you cross into small-cap territory and the floor tilts. Of 509 flagged moves, 61 reversed. That is 12 percent, more than double the mid-cap rate, and the jump happens in a single step down the ladder. Nothing halfway about it.
And the micro-caps, where the bulk of the action lives, finish the trend. This was by far the busiest tier: 1,680 flagged moves, well over half the entire dataset. Of those, 269 reversed, for a 16 percent rate. So roughly one in six unusual moves down here unwound within a day.
The mechanics behind it are the unglamorous ones. Smaller coins mean thinner liquidity, and thinner liquidity means it takes less money to move a price and less money to move it right back. A move that would barely dent a large-cap order book can pick a micro-cap up and set it down again before lunch. That is the entire physics of it, no conspiracy required, just size doing what size does.
What a Spiking Micro-Cap Is Actually Telling You
So you are scrolling, and something tiny is up a lot. What does the data say about that green candle? Only this: statistically, a flagged move in the smallest tier is the one most likely to hand it all back. Sixteen percent of them did exactly that. The other 84 percent held, which is worth saying plainly, most spikes, even down in the weeds, did not reverse.
The honest read is that "small coin, big move" is not a verdict, it is a probability shift. The likelihood of a round trip climbs steadily as you descend the size ladder, from roughly one in eighteen at the top to roughly one in six at the bottom. That is a different risk profile, not a different guarantee. A large coin doing something unusual carried far better odds of that move sticking. A micro-cap doing the same thing was playing on a stage with a trapdoor.
None of that tells you which specific spike is the real one and which is the mirage. It just tells you where the mirages cluster.
How the Count Was Kept
The method here is deliberately plain, because a study like this is only as good as its plumbing. Every move in the sample was flagged automatically as an unusual move, no cherry-picking, no hand-selected examples. Then each one was checked against the real market price one day later to see whether it held or reversed. That is the entire test: did the move survive contact with the next day, yes or no.
Run that across 3,141 flagged moves and the size effect stops being a hunch and starts being a measurement. The top of the market is a slow, heavy thing that mostly means what it says. The bottom is nimble, cheap to push, and quick to change its mind.
Same market, same rules, wildly different odds of the move being real. The only variable that moved was the size of the coin, and it moved everything.