Do Crypto Rallies Hold? 2,127 Spikes vs 1,014 Sell-Offs
Two Animals, Not One
Picture two coins on the same screen, same afternoon. One rips upward on a burst of green. The other cracks and bleeds red. To a casual eye they look like mirror images, the same event pointing opposite ways.
They are not mirror images at all. One of them is far more likely to be lying to you.
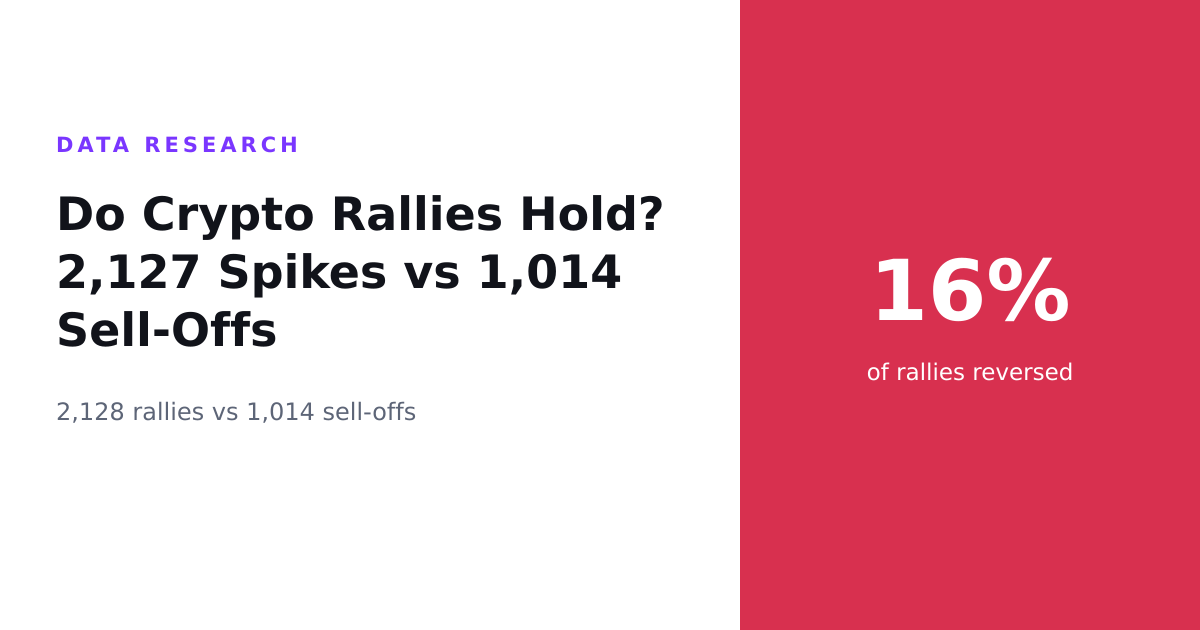
Across 3,141 unusual moves measured against the real market price one day later, the pattern is lopsided in a way that should make anyone reaching for a spike pause. Of 2,127 rallies flagged, 341 reversed. That is a 16 percent reversal rate. Of 1,014 sell-offs flagged, only 43 turned around. That is 4.2 percent.
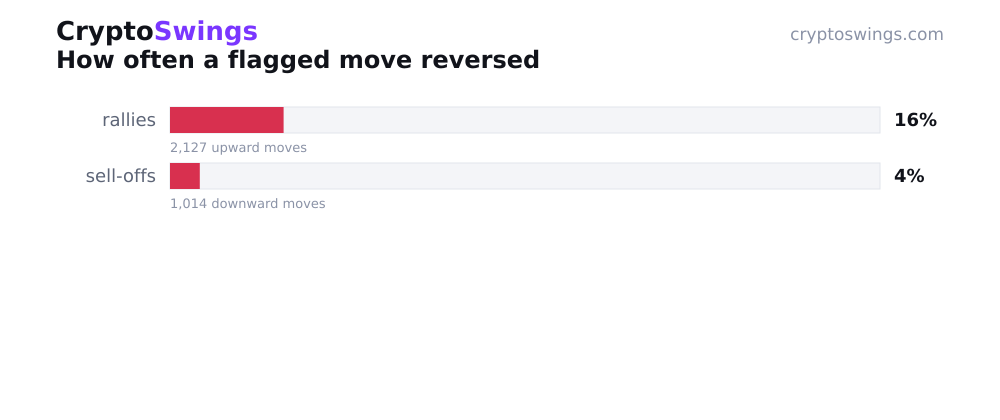
Same market, same measuring stick, two completely different creatures. A spike snapped back nearly four times as often as a drop did. Whatever pulls a coin down tends to keep it down. Whatever shoves it up has a habit of losing its grip.
The Other Side of the Coin
Reversals are only half the ledger. The more interesting question is what happens to the moves that don't flip. Do they keep running, or do they just sort of sit there and shrug?
Here the sell-offs show their teeth. Of the drops, 49.5 percent kept going the same direction, digging deeper the next day. Rallies managed that far less often: only 35.3 percent kept climbing after the initial pop.
Put the two ends together and a third fact appears almost by subtraction. Most flagged moves did neither cleanly. They didn't fully reverse and they didn't cleanly extend. They drifted, chopped, and settled somewhere in the fuzzy middle that charts love and headlines hate. The dramatic outcome, the clean snapback or the clean continuation, is the exception. The muddle is the rule.
But when a move does commit, the direction matters. A dump that means it tends to keep meaning it. A pump that means it is the rarer bird.
What a Spike Is Actually Telling You
So a coin is screaming upward right now, and you're staring at it. Here is what the numbers describe, not what to do about them.
A rally that survives the day is common enough. 84 percent of them held rather than reversed. That sounds reassuring until you sit it next to the sell-off column, where 95.8 percent held. By that comparison a spike is simply a shakier structure. It stands up most of the time, but it collapses often enough to notice, and it extends less often than a sell-off does when it decides to move.
The cleanest way to say it: a rally is a promise, and a sell-off is a verdict. Promises get broken. Verdicts get enforced. The tape doesn't care about your entry price either way.
None of this predicts the next candle. It describes what a large pile of past candles did, and the pile leans hard in one direction. It's the kind of asymmetry that CryptoSwings keeps quietly bumping into whenever a green spike gets measured against a red one, and it's stubborn enough to be worth remembering the next time a chart lights up.
How a Move Earns Its Flag
The mechanics here are deliberately dull, which is the point. Every figure comes from moves that got flagged automatically as unusual, meaning the price did something out of its ordinary range rather than something a person decided was interesting after the fact. No cherry-picking, no hindsight.
Each flagged move then gets a scorecard. One day later, the outcome is checked against the real market price. Did the move hold its ground, reverse, or extend? That single follow-up reading is what separates a reversal from a hold, and a hold from a continuation.
It's a plain method, and it produces a plain result. Rallies reversed 16 percent of the time, sell-offs 4.2 percent. Rallies extended 35.3 percent of the time, sell-offs 49.5 percent. Two directions, same market, wildly different odds of following through.
The screen shows you two coins going opposite ways and dares you to treat them the same. The data, across more than three thousand tries, quietly declines the dare.