Crypto Pump and Dump Tracking: What 3,144 Flagged Moves Reveal
The Number That Sorts the Whole Board
Picture two flagged spikes hitting the tape at the same moment. One belongs to a heavyweight, a coin near the top of the market. The other belongs to a micro-cap most people have never typed into a search bar. Both look identical on the screen at that first green candle. A day later, one of them has quietly betrayed everyone who chased it, and the odds of that betrayal were not the same at all.
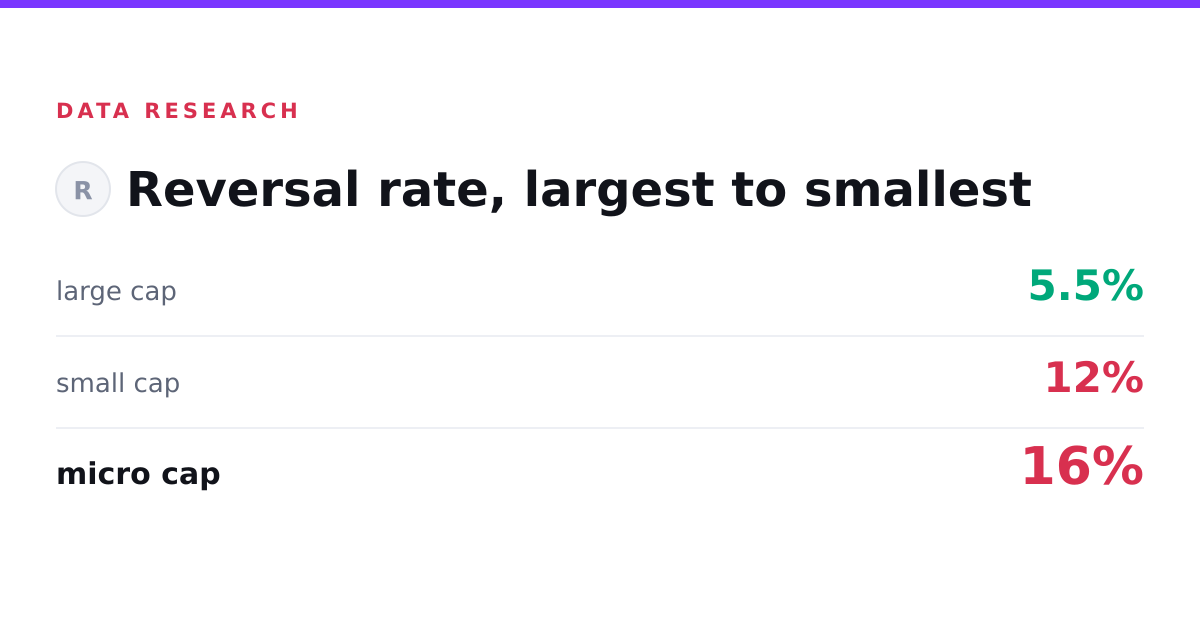
That is the finding at the center of this pump and dump tracking study: across 3,144 automatically flagged moves, a spike in the smallest coins reversed nearly three times as often as a spike in the largest. The exact multiple is 2.9. Same market, same measuring stick, wildly different outcome depending on nothing more than the coin's weight class.
Of the full 3,144 moves, 384 ended up reversing. That is the raw material. The interesting part is not the headline rate, it is how unevenly those reversals were distributed once you sort the moves by the size of the coin they happened to.
Walking the Four Weight Classes
Start at the top and work down, because the pattern only reveals itself in order.
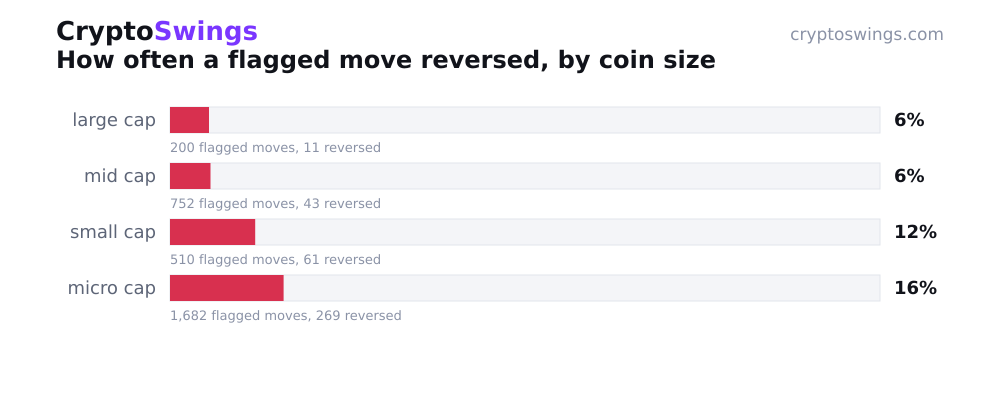
The large coins produced 200 flagged moves. Eleven of them reversed. That is a reversal rate of 5.5 percent, which means roughly 94.5 percent of the time, a flagged move in a big coin was still standing a day later. The heavyweights, in short, mostly meant it.
The mid-caps looked almost identical. Out of 752 flagged moves, 43 reversed, for a rate of 5.7 percent. Statistically that is a rounding error away from the large-cap number. Two different tiers, two different sets of coins, and the tape treated them nearly the same. If you were expecting a smooth slope from big to small, the first two steps are basically flat.
Then the floor drops.
The small-cap tier logged 510 flagged moves, and 61 of them reversed. That pushes the reversal rate to 12 percent, more than double what the mid-caps posted. The jump is abrupt. Nothing in the top two tiers hints that it is coming, and then it arrives all at once.
The micro-caps are where the study earns its conclusion. This was by far the busiest tier, with 1,682 flagged moves, more than the other three combined. Of those, 269 reversed, for a reversal rate of 16 percent. So in the smallest, thinnest corner of the market, roughly one flagged move in six had unwound within a day.
There is no exotic explanation required here. Smaller coins carry thinner liquidity, and thin liquidity is what lets a move inflate fast and deflate faster. Less capital is needed to push the price up, and less is needed to pull it back down. The size of the coin is, more or less, the size of the risk that the move was hollow.
When You See a Small Coin Light Up
So a micro-cap is ripping across your screen. What does the record actually say about that moment?
It says the move is more fragile than an identical-looking move in a large coin. Not doomed. Even in the smallest tier, 84 percent of flagged moves held a day later, so most spikes were not reversals. But the frequency of reversal was much higher down there, and that is a fact about the terrain, not a mood.
The useful reframe is this: a flagged spike is not one thing. It is a different bet depending on the coin's weight class. The same shape on the chart carried roughly a one-in-eighteen reversal rate in the biggest coins and roughly a one-in-six rate in the smallest. If you treat those two as the same event, the data says you are quietly mispricing the small one.
That is the whole practical takeaway, and it deliberately stops short of telling you what to do about it. The record describes the ground. Where you step is your business.
How the Moves Were Counted
None of this rests on hand-picked examples, which is the point. Every move in the study was flagged automatically the moment it registered as unusual. No human sat there deciding which spikes were interesting and which were not. The system caught them as they fired.
Then the outcome was settled against reality. For each flagged move, the outcome was checked against the real market price one day later. If the move had substantially unwound by then, it counted as a reversal. If it was still standing, it held. There is no interpretation layer, no vibes, no story about what the move was supposed to mean. Just the price then, the price a day later, and the difference between them.
The reversal figures come from CryptoSwings, which logs these unusual moves as they happen. Tracking began on June 5, 2026, and the 3,144 moves are simply everything that has been flagged and resolved since.
Crypto Pump and Dump Tracking, Answered Directly
If you came here typing "crypto pump and dump tracking" into a search bar, the question underneath it is usually some version of: how often do these sudden spikes actually fall apart, and does it depend on the coin?
The direct answer: across 3,144 tracked moves, 384 reversed within a day, and the rate depended heavily on coin size, ranging from 5.5 percent in the largest coins to 16 percent in the smallest. That is the spread. Down at the micro end, reversals arrived nearly three times as often as they did at the top.
So the honest one-line version of pump and dump tracking is that most flagged spikes held, but the ones that did not were concentrated where the coins were smallest and the water was thinnest. The big coins reversed rarely. The mid-caps reversed rarely. The small and micro tiers are where the give-backs pooled up. If someone tells you a spike is a spike is a spike, the record disagrees, and it disagrees by a factor of almost three.
It is worth restating that the two heavy tiers were nearly indistinguishable, 5.5 against 5.7 percent, while the two light tiers, 12 and 16 percent, sat in a completely different neighborhood. The dividing line in this data is not gradual. It is a wall between the top half of the board and the bottom half.
What This Record Cannot Do
Now the part that keeps the whole thing honest.
This is a record of what happened, not a forecast of what will. A 16 percent reversal rate in the micro tier is a description of 1,682 moves that already resolved. It is not a probability stamped on the next spike you happen to be staring at. The next one is its own event, and the record does not know it exists.
The window is also fixed. Every outcome here was measured one day later, no sooner and no later. A move that held for a day and then collapsed on the second day counts as held in this study, because the study stopped looking after a day. A different measurement horizon could redraw these numbers, possibly a lot. The pattern you are reading is specific to the yardstick used to build it.
The tiers are uneven too, and that matters for how much weight each one carries. The micro bucket rests on 1,682 moves, a large and confident sample. The large-cap bucket rests on 200. Both point the same direction, and the gap between them is wide enough that the difference is not noise, but the biggest coins simply produced fewer flagged moves to learn from. Where a tier had too few cases to say anything meaningful, it was left out rather than dressed up.
What would change the picture? A longer track record, a different day count on the outcome, or a stretch of market that behaves nothing like the one since June 5. Any of those could bend the curve. Until then, the shape on record is clear and it is stubborn: the heavyweights kept their word most of the time, and the smallest coins were where flagged moves came apart. Nearly three times as often, in fact, and the tape did not hide it.