How to Spot a Pump and Dump Before It Happens: 2,130 Spikes vs 1,014 Sell-Offs
Four Times More Likely to Turn on You
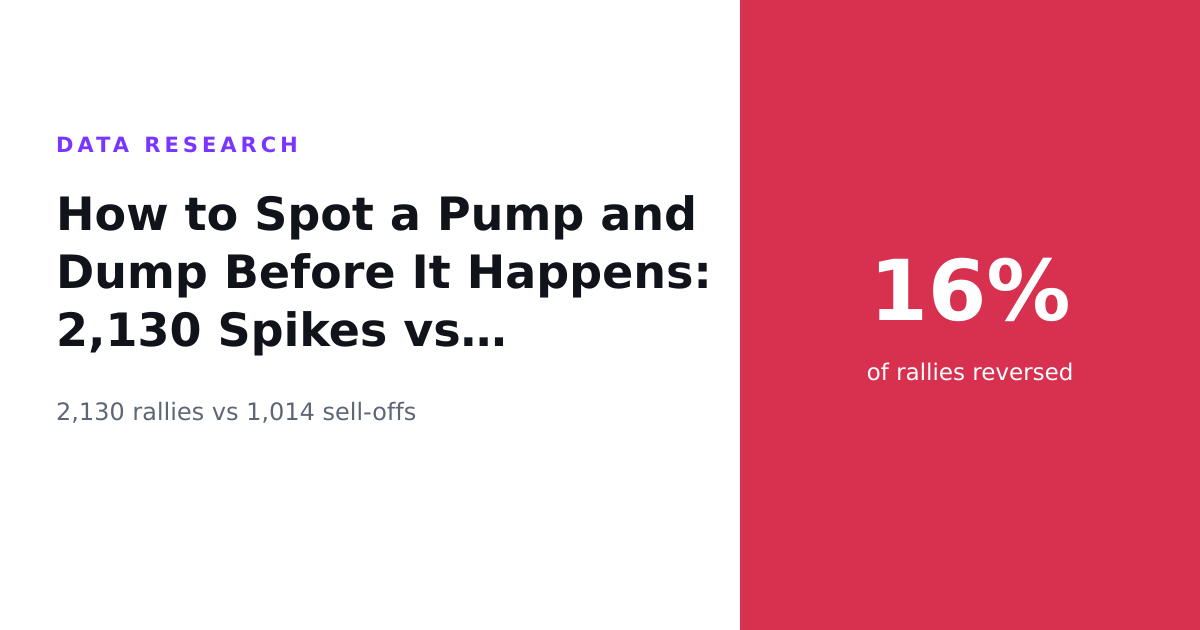
Sixteen percent.
That is how often a flagged rally reversed within a day across a very large sample. Now hold it next to its opposite number: a flagged sell-off reversed just 4.2 percent of the time. Same market, same measuring stick, and one of these directions was almost four times likelier to betray the people holding it than the other.
That is the whole study in one line, and it is worth sitting with before we get to the arithmetic underneath it.
The numbers come from 3,144 automatically flagged unusual moves. Of those, 2,130 were rallies and 1,014 were sell-offs. The rallies gave back their gains 341 times. The sell-offs snapped back only 43 times. So the next time you are asking yourself how to spot a pump and dump before it happens, start here: the direction of a move already tells you something about how much you should trust it.
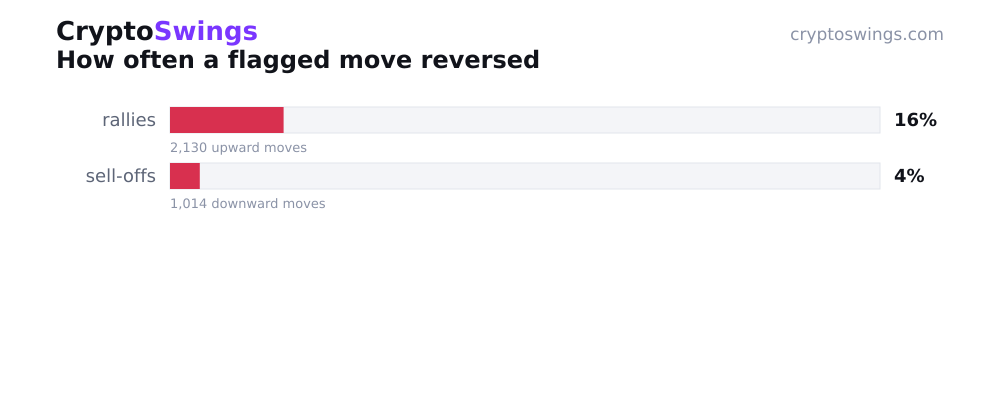
An upward spike is a promise. A downward spike is usually a fact that already happened. The data treats them very differently, and so should you.
What Held, and What Just Kept Rolling
Flip the reversals over and you get the other half of the picture. If 16 percent of rallies reversed, then 84 percent of them held their ground a day later. For sell-offs the hold rate was even sturdier: 95.8 percent stayed down. Once a coin drops on unusual volume, it tends to stay dropped. Gravity has excellent follow-through.
But holding is not the same as extending. The most interesting column in this table is the one that measures how often a move actually kept going in the same direction. Rallies did that 35.2 percent of the time. Sell-offs kept sliding 49.5 percent of the time.
Read those two figures carefully. Fewer than half of the sell-offs kept falling, and only about a third of the rallies kept climbing. Which means the single most common outcome for a flagged move was neither a clean continuation nor a clean reversal. Most moves just drifted into something murkier, holding roughly where they landed, neither confirming the story nor fully unwinding it.
The clean, satisfying outcomes are the rare ones. The market mostly deals in shrugs.
Watching a Coin Light Up Right Now
So a coin on your screen is suddenly green and loud. What does the record actually say about that moment?
It says the odds of a clean betrayal are real but modest. Sixteen percent of rallies handed the gains back. Not most. Not even close to most. But a one-in-six chance of a full reversal is a very different animal from the roughly one-in-twenty-five chance a fresh sell-off suddenly turns around. The upside spike carries far more built-in fragility than the downside one does.
And the continuation numbers keep you honest in the other direction. A rally only pressed on about a third of the time. So the green candle in front of you is not a launch signal and it is not a countdown to a crash. It is a coin that, more often than not, is about to do something unremarkable.
That is the unglamorous shape of the pattern. A spike is more likely to fizzle into nothing than to either moon or collapse. Which is exactly why the loud ones are so seductive and so exhausting to chase.
How a Move Earns a Flag
Worth being clear about where these numbers come from, because a study is only as trustworthy as its plumbing.
Every figure here traces back to an unusual move that got flagged automatically. A coin does something out of character on the tape, an abrupt spike, a sharp drop, the kind of candle that stands out against its own recent behaviour, and the system marks it. No hand-picking, no cherry-picking the ones that made a good story afterward.
Then comes the only test that matters: what did the price actually do? The outcome for each flagged move was measured against the real market price one day later. Did the spike hold or hand it all back. Did the drop stick or bounce. A rally that gave up its gains counts as a reversal. A drop that kept dropping counts as continuation. Clean, mechanical, judged after the fact against the honest number.
That is the entire method. Flag the odd move, wait, check the tape. No opinions in the middle.
How to Spot a Pump and Dump Before It Happens
Here is the question as a reader would actually type it: how to spot a pump and dump before it happens?
The direct answer from this data: you can't catch the specific one, but you can read the odds, and the odds say a flagged rally reversed 16 percent of the time versus 4.2 percent for a sell-off. A sudden upward spike is structurally more likely to unwind than a sudden drop is to recover. That asymmetry, nearly four to one, is the closest thing to an early warning the numbers offer.
Notice what that answer is not. It is not a signal that fires before the top. It is not a tell hidden in the candle. It is a base rate. It says that upward spikes, as a category, are the fragile ones, and that most of them do not go on to a clean second act, only 35.2 percent kept climbing.
So the honest version of spotting a pump and dump before it happens is this: treat a loud rally as the more suspect of the two directions, because the record says it is. That is a frame, not a fortune-teller. The tape will still surprise you. It just surprises you in a lopsided way, and now you know which way it leans.
What These Numbers Refuse to Promise
Time for the part every honest study needs.
This is a record of what happened, not a map of what will. Every figure here is backward-looking. Sixteen percent of past flagged rallies reversed; that does not obligate the next rally to reverse 16 percent of the time, and it certainly says nothing about the specific coin blinking on your screen right now. The next one is its own coin.
The window is fixed, too. Every outcome was scored one day later. Stretch that horizon and the whole table would redraw itself. A rally that held for a day might still crumble on day three; a sell-off that stuck might grind back over a week. This study has nothing to say about any of that, because it only ever looked one day out. Different clock, different answers.
And the sample, large as it is, is not perfectly even. The rallies outnumber the sell-offs, 2,130 to 1,014, so the two sides are not measured with identical statistical weight. Any thin sliver of data with too few cases to trust was left out entirely rather than dressed up as a finding. That keeps the headline numbers clean, but it also means the picture is built from the categories that had enough moves to say anything at all.
What would change the picture? A longer horizon. A different flagging threshold. A market regime that behaves nothing like the one that produced these 3,144 moves. Any of those could shift the odds.
But within its own boundaries, the finding holds steady and it is not subtle. Across more than three thousand flagged moves, the rally was the untrustworthy one, a spike far more prone to hand it all back than a drop ever was to give it all back. The market rewards suspicion of the loud green candle. It usually does.