How Often Big Crypto Moves Reverse: 7,113 Flagged Moves
One Number, Measured 7,113 Times
Here is the whole study in a single comparison, before we get fancy about it.
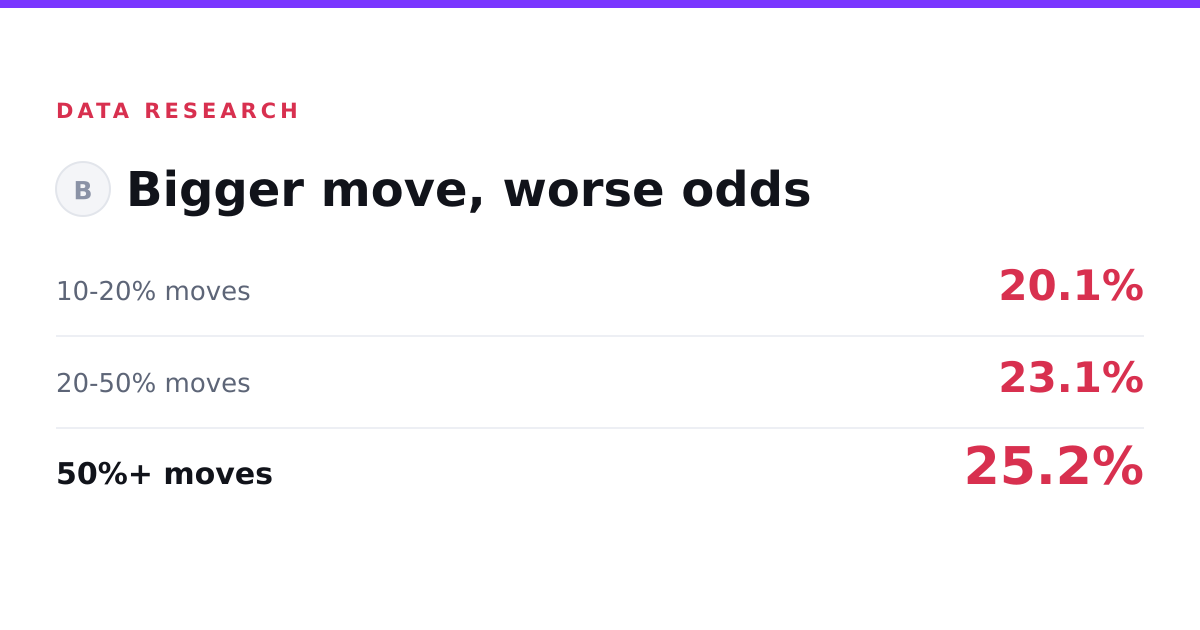
A flagged move over 50% reversed about one time in four. A quiet one under 10% did it roughly one time in eleven.
Same market, same measurement, wildly different odds. The pattern underneath those two figures is the kind of thing that sounds obvious once you say it out loud and turns out to be true when you actually count: the bigger the move, the more often it failed to stick.
We counted. Across 7,113 automatically flagged unusual moves, each one checked against the real market price one day later, the relationship held in a straight line. Small moves held. Big moves wobbled. And the gap between the two ends is wide enough that it is worth looking at properly.
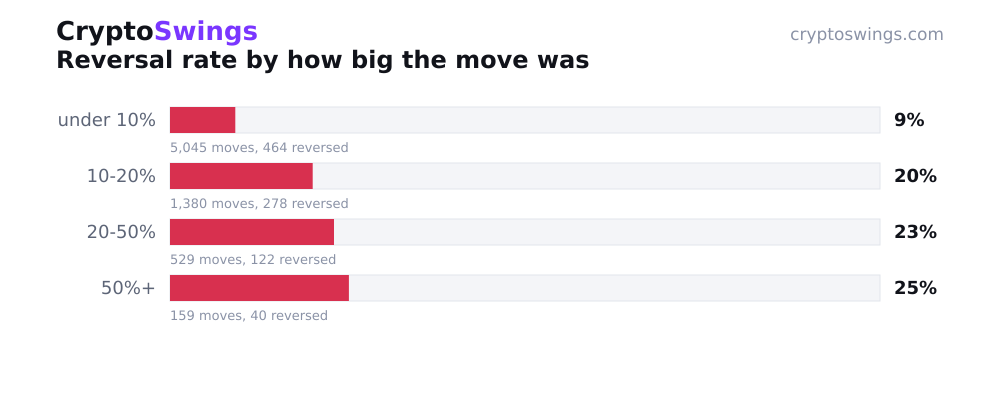
The under-10% group carried the whole thing on its back, size-wise. Out of 5,045 of those smaller moves, only 464 reversed. That is a 9.2% reversal rate, which means 90.8% of them were still pointing the same way a day on. Modest moves are, apparently, modest about changing their minds.
The 50%+ band is the opposite temperament. Only 159 moves that big showed up at all, but 40 of them had snapped back within a day. That is a 25.2% reversal rate. One in roughly four of the market's loudest single-day performances turned around and gave it back.
A quick, important caveat before anyone reads these as a tip sheet: these are observed frequencies. Things that already happened, tallied up. Nobody here is telling the future. We are just reading the ledger.
The Four Bands, In Their Own Words
Let's walk the staircase one step at a time, because the climb is the story.
The under 10% band is the floor and the foundation: 5,045 moves, a 9.2% reversal rate, a 90.8% hold rate. These are the market's background noise, and background noise mostly stays put.
The 10-20% band is where things get interesting. Across 1,380 of these, the reversal rate more than doubled to 20.1%. Nudge the move size up a notch and the odds of a round trip jump sharply. The hold rate here is 79.9%, so most still stuck, but the comfort of the smaller band is already fading.
The 20-50% band keeps the trend going, just more gently. Out of 529 moves, the reversal rate was 23.1%, hold rate 76.9%. Notice the slope flattening. The big leap in fragility came between the first band and the second. After that it is a steadier incline.
The 50%+ band tops it off at 25.2% reversing, 74.8% holding, across those 159 cases. The most dramatic moves on the board were also the most likely to betray the direction they started in, though even here, three in four held their ground.
Four bands, one clean trend: 9.2, then 20.1, then 23.1, then 25.2. Every step up in size is a step up in reversal odds. And again, to be clear, that is a description of what the tape did, not a promise of what it will do next.
*Previously: Four Climbed 42% And Still Ended The Day Underwater*
Reading A Monster Candle In Context
So what do you do with a 50-plus-percent spike when you see one in the wild?
Nothing, if the question is advice, because there isn't any here. But the numbers do add a layer of context that is genuinely useful to hold in your head.
A spike that big arrives wearing confidence. It fills the chart, it dominates the board, it looks like conviction made visible. The data gently points out that moves of that size were, historically, the single most likely category to turn around within a day. One in four of them did exactly that.
That is not the same as saying the next one will. Most of them in the 50%+ band, 74.8% of them, held. The point is simply that a huge move carries a meaningfully higher reversal frequency than a small one, and the chart gives you no warning about which camp it is in. The size tells you the odds of a round trip are elevated. It tells you nothing about this particular round trip.
Context, not instruction. A big candle is louder, not safer, and now you have the count to put a figure on how much louder.
How The Count Was Taken
Worth being plain about the machinery, because a number means nothing if you don't know how it was built.
Every figure here comes from automatically flagged unusual moves. Each flagged move had its outcome measured against the real market price one day later. If the move had reversed by then, it went in the reversal column. If it was still pointing the same way, it counted as held. That is the entire test. No cleverness, no adjustment, just before and after.
The sample skews small, by nature. 5,045 of the 7,113 moves live in that under-10% band, which is why its 9.2% rate is the most solidly supported figure in the whole study. The 50%+ band, with its 159 cases, is the thinnest. Enough to report with a straight face, not enough to carve into stone. Bands that didn't clear a usable count weren't included at all, which is the boring but correct way to keep a small sample from pretending to be a big one.
One measurement, one day later, four buckets with enough cases to mean something. That is the study.
How Often Do Big Crypto Moves Reverse?
Here is the question a lot of people actually type, stated plainly: how often do big crypto moves reverse?
The direct answer, from this sample: a move over 50% reversed within a day about 25.2% of the time, which works out to 40 out of 159 of the largest flagged moves. Scale down and the number falls with it. The 20-50% group reversed 23.1% of the time, the 10-20% group 20.1%, and the smallest moves under 10% reversed just 9.2% of the time.
So "big crypto moves" reverse somewhere between roughly a fifth and a quarter of the time, depending on how big is big, while the small stuff holds nine times out of ten. The exact answer depends entirely on where your move lands on that staircase. Bigger means more fragile. The whole dataset says so in one consistent direction.
The figures above come from CryptoSwings, which tracked and measured the outcome of all 7,113 flagged moves in this run.
What This Can't Tell You
Now the honest part, because a study that only brags is a study you shouldn't trust.
This is a record, not a crystal ball. It describes what a pile of flagged moves did after they happened, and it does that one way: outcome measured against the real price one day later. Stretch that window and the whole table could shift. A move that looks held after one day might not look held after three. A move that reversed quickly might have come roaring back after that. The study has one vantage point in time and reports only from there.
It also can't tell you which individual move is which. The 50%+ band reversed about a quarter of the time, which means it also held about three-quarters of the time, and nothing in this data flags which spike belongs to which outcome before the day plays out. The rate is a property of the whole band, not a label on any single candle.
And the thin buckets stay thin. With 159 cases in the top band, the 25.2% figure is a reasonable read, not a law of physics. More data could nudge it. Bands too sparse to count honestly were left out entirely, because a rate built on a handful of moves is just a rumor with a decimal point.
What would change the picture? A different measurement window. A larger sample in the big-move bands. A longer run of market history. Any of those could shift the numbers.
Until then, the staircase stands as counted: small moves mostly hold, the biggest moves reverse about a quarter of the time, and every rung in between behaves exactly as politely as its size suggests.