Stellar (XLM) Price Moves: 43 Flagged, 0 Reversed
Forty-Three Moves, One Habit
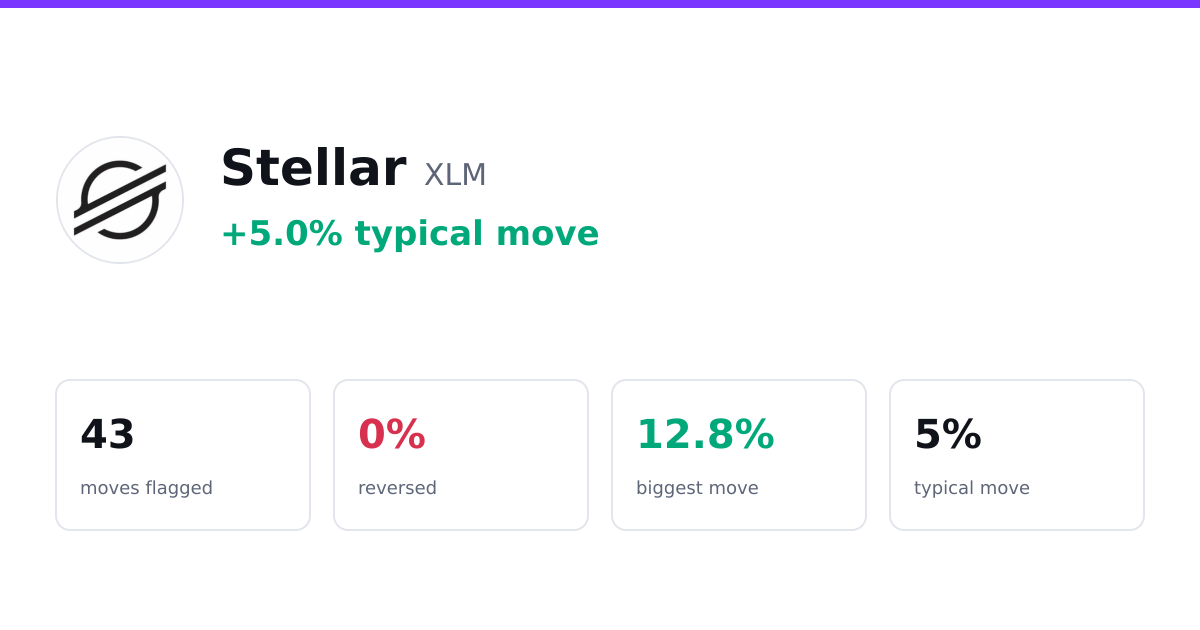
Between June 10 and September 17, 2026, Stellar produced 43 unusual price moves, and not a single one of them reversed direction a day later.
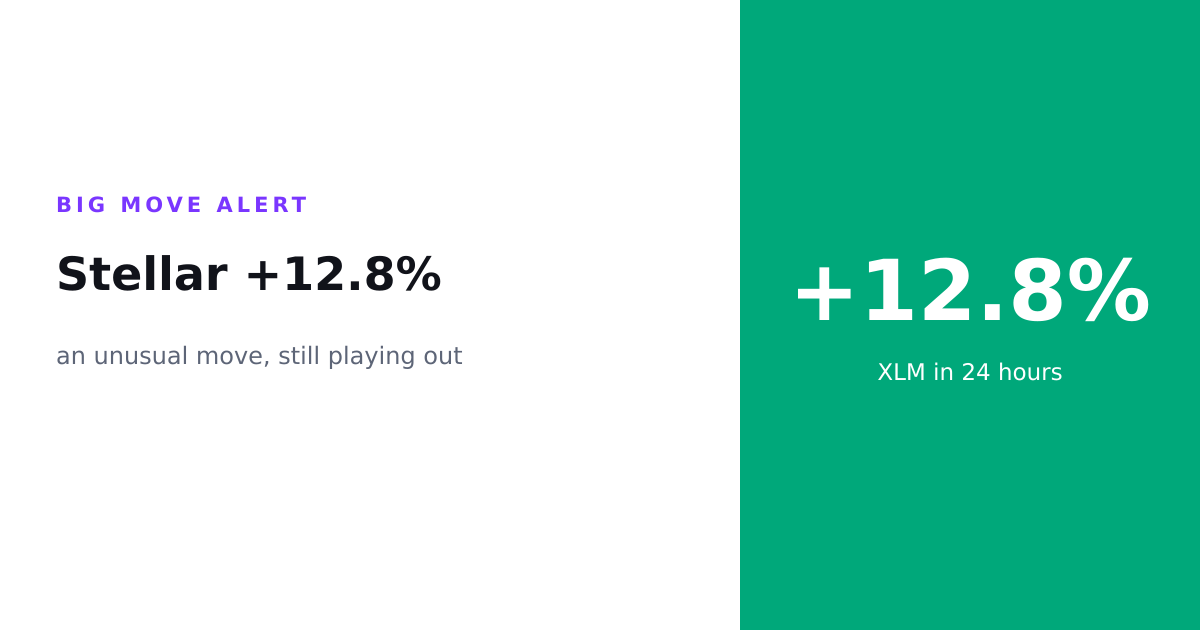
*Previously: Stellar Jumps 12.8% and Sets a New Personal Best*
That is the whole plot in one line, and it is a strange one. Most coins have a bit of a personality flaw. They fake you out, they overshoot and snap back, they promise green and deliver red by the next morning. Stellar, over these three months, did none of that. Whatever direction it chose when it made a big move, it was still pointed that way a day later. Every time. Forty-three for forty-three.
You do not see that often. So let's slow down and look at what these moves were actually made of.
The Shape Of A Stellar Swing
Start with size, because size is where the surprises usually hide, and here they mostly don't.
The typical unusual move over this stretch ran about 5%. That is a meaningful shove for an established coin, big enough to get flagged, but it is not the kind of triple-digit fireworks show that turns micro-caps into daily headlines. Stellar moved with the posture of something that has been around a while. It stepped, it did not leap.
The biggest single move of the entire window was 12.8%. That is the ceiling. No candle in three months stretched further than that, which tells you something on its own: this was not a coin whipsawing between euphoria and panic. It was a coin doing measured, repeatable business.
And here is the part I find genuinely tidy. Of the 43 moves, 21 were rallies and 22 were sell-offs. That is about as even a split as a market can hand you. Stellar was not a one-way trade in either direction. It climbed and it dropped in almost equal measure, and the notable thing is that both the ups and the downs shared the same discipline. When it went up, it stayed up a day later. When it went down, it stayed down. No take-backs on either side of the ledger.
Balanced, steady, and stubborn about following through. If a coin could have a firm handshake, this would be it.
Why Zero Is The Number That Stands Out
To feel how unusual a clean sweep like this is, you need something to measure it against.
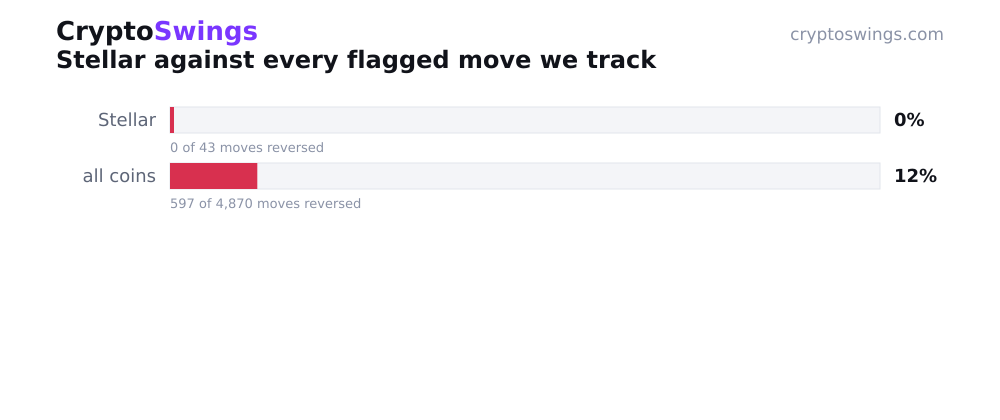
Across every coin being tracked, the average reversal rate sits at 12.3%. Meaning: take a big move at random from the whole board, and roughly one in eight of them has flipped direction by the next day. Fakeouts are a normal feature of the tape. They are priced in, expected, part of the weather.
Stellar's reversal rate over these three months was zero percent.
Not low. Zero. Across 43 separate opportunities to change its mind, it never did. When a coin sits that far below the typical fakeout rate, the interesting question stops being "did it hold?" and becomes "does it ever *not* hold?" And within this window, the answer is simply no. Every move that started, finished in the same direction it began.
That does not make Stellar special forever. It makes it remarkably consistent for one specific stretch of time. Which is worth saying plainly, because a streak and a law of nature look identical right up until the streak ends.
What Counts As A Move Here
Fair to explain the ruler before we lean on the measurements.
Every figure in this report comes from moves that were automatically flagged as unusual, meaning the price did something large enough to stand out from its ordinary background chatter. A quiet drift does not qualify. A real, notable swing does. That is how a coin ends up with a count like 43 rather than a count of every tick it ever made.
The outcome of each move is judged one thing and one thing only: where the real market price sat one day later, compared to where the move pointed. If a coin rallied and the price was still up a day on, that move held. If it rallied and the price had rolled back over, that move reversed. Same logic in reverse for sell-offs. No interpretation, no mood reading, just the price then versus the price a day later.
By that measure, Stellar's 43 moves produced 43 holds. Clean arithmetic, and the kind that is easy to double-check precisely because the rule is so blunt.
So Did Any Of Stellar's Big Moves Reverse?
Here is the direct question: over this period, did Stellar's unusual price moves tend to reverse within a day?
No. Zero of the 43 flagged moves reversed. The reversal rate was zero percent, against a 12.3% average across all tracked coins. Whether Stellar was climbing or sliding, and it did each about half the time, the direction it took when it moved was the direction it kept a day later, in every single instance recorded between June and September.
That is not a coin that lures you in and yanks the rug. Over this window, at least, a Stellar move meant what it looked like it meant. The rally that started stayed a rally. The sell-off that started stayed a sell-off. For a coin that has spent years being described as one of the older, steadier hands in the room, the data here is almost on-brand. It behaved like the reliable friend who says they will be there at seven and is there at seven.
The Parts A Clean Streak Can't Promise
Now the necessary cold water, because a run this clean invites more confidence than it can actually support.
This is a record of what happened. It is not a forecast of what happens next. Forty-three consecutive moves holding their direction is a real, observed fact about June through September of 2026, and it is exactly as binding on tomorrow as any past streak has ever been, which is to say not at all. The forty-fourth move owes this dataset nothing.
The window is fixed. Everything here lives between June 10 and September 17, and the story could read differently the moment you widen or shift those dates. A single sharp fakeout next week would drag that zero off the floor, and the picture would change with it. Zero is a fragile number precisely because it has nowhere to go but up.
There is also a floor-count issue worth flagging in general: when you slice market behavior into small buckets, the ones with too few cases get thin enough that a single move swings the whole read, so those get set aside rather than dressed up as meaningful. Stellar's 43 is a healthy sample by micro-slice standards, but it is still one coin over one season, not a verdict on the asset for all time.
And the measurement only ever looks one day out. A move that held firm the next day could have crumbled the day after, and this ruler would never see it. Holding within a day is a specific claim, not a permanent one.
So here is the honest shape of it. Over three months, Stellar was flagged 43 times, split almost evenly between rallies and sell-offs, capped at a 12.8% top move, and it reversed exactly none of them while the wider board was flipping roughly one in eight. That is a genuinely tidy record. It is also a record, past tense, and the tape has never once felt obligated to repeat itself just because the last chapter read well.