How Often Big Crypto Moves Reverse: 3,141 Flagged Moves
The broader crypto market has spent a good stretch of the summer looking sleepy, with the majors trading in a narrow range while all the real drama happens down at the small end of the board. So let's go where the drama lives and ask a simple question: when a coin makes a big, dramatic move, how often does it actually mean something a day later?
Small Twitches Stick, Big Leaps Slip
Here is the pattern, and it is not subtle. The larger the move, the more often it came undone.
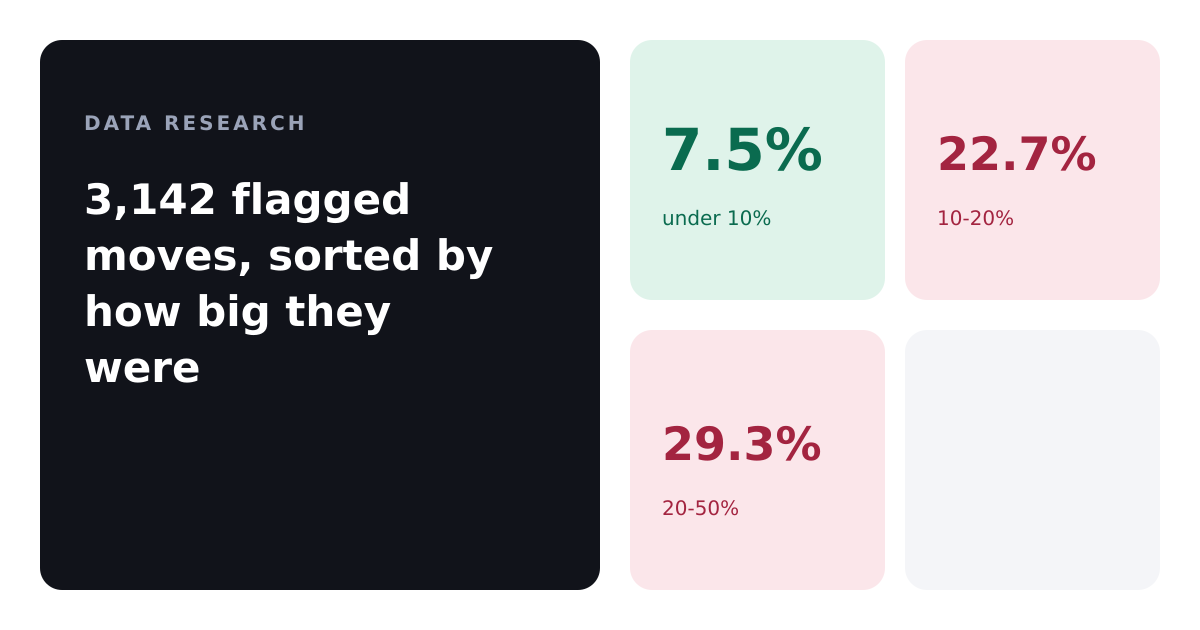
At the quiet end of the spectrum, moves under 10 percent held up remarkably well. Out of 2,282 such moves, only 172 reversed within a day. That is a reversal rate of 7.5 percent, which means better than nine in ten small moves were still standing the next day.
Now climb to the top end. Among moves of 20 to 50 percent, there were 225 cases, and 66 of them reversed. That is a 29.3 percent reversal rate, nearly four times the failure rate of the small twitches.
Same market, same measuring stick. The difference is entirely the size of the leap.
Three Bands, Three Fates
Walk the ladder rung by rung and the trend is clean the whole way up.
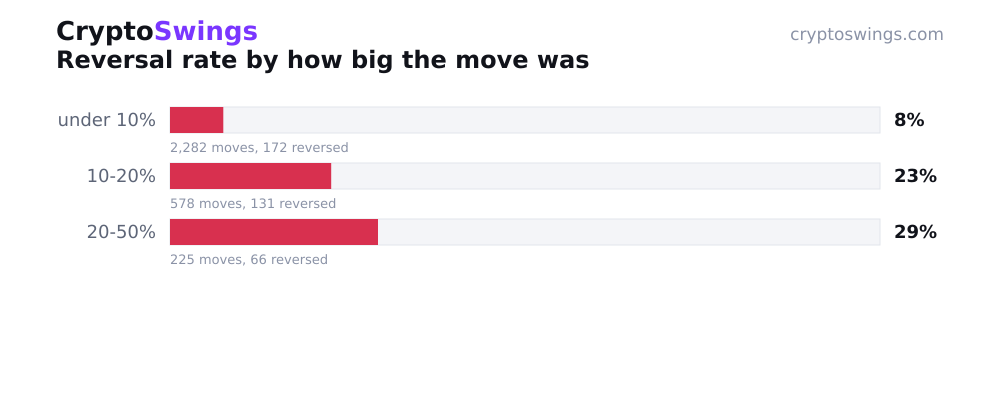
The small band, under 10 percent, is the steadiest ground on the chart: 2,282 moves, a 7.5 percent reversal rate, a 92.5 percent hold rate. When a coin nudges a few percent, the nudge usually sticks.
The middle band, 10 to 20 percent, is where things start to wobble. Across 578 moves, 131 reversed. That works out to a 22.7 percent reversal rate, roughly one in five, leaving 77.3 percent that held. Triple the reversal risk of the small band, just for doubling the size of the move.
The top band, 20 to 50 percent, is the shakiest of the three. Of 225 moves, 66 came undone, for that 29.3 percent reversal rate and a 70.7 percent hold rate. Even here, note the honest detail: most big moves still held. Reversal is more common at the top, not the default.
One thing worth saying plainly. These are observed frequencies, counts of what already happened, not odds on what happens next. Nothing here predicts your favorite coin's afternoon. It simply describes how a very large pile of past moves behaved once the dust settled.
Reading a Fireworks Show
So what do you do with a coin that just ripped 30 percent while you were making coffee?
Nothing here tells you. But it does give you context, and context is the whole point. A 30 percent spike lands squarely in the band where nearly three in ten moves unwound within a day. That does not make it a fake. Seven in ten of those big moves held their ground. It just means the biggest, loudest moves carry the highest historical odds of walking themselves back, and a small quiet move carries the lowest.
The tape rewards a certain humility here. The candle that grabs your attention with the most screen-filling green is, statistically speaking, the same candle that has historically been most likely to disappoint by morning. Size is the tell. The bigger the number, the more often it turned out to be borrowed rather than kept.
How the Count Was Kept
The mechanics are straightforward, and worth spelling out so the numbers mean what they say.
Every figure here comes from automatically flagged unusual moves, with each outcome measured against the real market price one day later. A move that gave back its gain in that span counts as a reversal. A move that stayed put counts as held. No modeling, no interpretation, just before-and-after on 3,141 flagged moves, with the observed frequency of each pulled from data collected by CryptoSwings.
The bands themselves are honest about their own limits. Only ranges with enough cases to be worth reporting made the cut, which is why the study stops at the 20-to-50 percent tier. Push further into the truly extreme moves and the sample thins out fast, and a rate built on a handful of examples tells you more about luck than about the market. Three bands, 3,141 moves, one clean trend.
Small moves keep their word. Big moves, more often than the small ones, take it back.