Hyperliquid (HYPE) Price Moves: 40 Flagged, 5 Reversed
Forty Moves, Five Second Thoughts
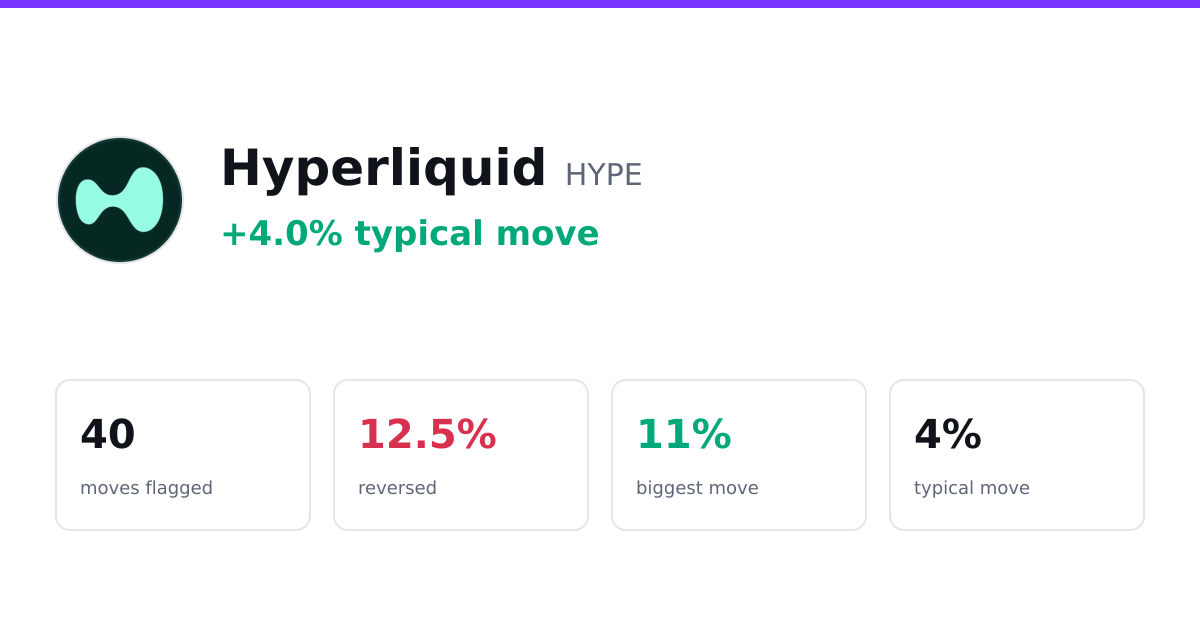
If you pull up an altcoin price chart for Hyperliquid and watch how it behaves when it lurches, here is the number that frames everything: across forty unusual moves flagged between June 5 and August 16, 2026, only five of them reversed within a day. That is the whole story in one line, and it is a fairly calm line for a market where calm is not the house style.
*Previously: Hyperliquid Takes a 3% Detour and Comes Back Like Nothing Happened*
Five out of forty. Hyperliquid, ticker HYPE, spent a little over two months getting flagged for moves large enough to notice, and most of the time the move stuck. It did what it did and then, more often than not, it kept doing it. That is rarer on a chart than you might guess.
The Size of the Jolts
The moves themselves were not the kind that make you spill your coffee. The typical flagged move for HYPE ran about 4 percent, a genuine jolt, enough to trip the flag, but not a coin flinging itself across the room.
The biggest one landed at 11 percent. That is the outer edge of the range, the single loudest thing HYPE did in the window, and by the standards of the small end of the market, an 11 percent swing is a polite nudge. Some coins put that up before breakfast and give it all back before lunch.
The split between directions is the part I find quietly interesting. Of the forty flagged moves, eighteen were rallies and twenty-two were sell-offs. Slightly more red than green, in other words. HYPE was flagged for falling a touch more often than for climbing, which tells you the drama was spread across both sides of the ledger rather than being one big up-and-down spectacle.
So the shape of it: modest-sized moves, a mild lean toward sell-offs, and a top-end that never got truly wild. A steady chart, as these things go.
Staying Put Is the Habit
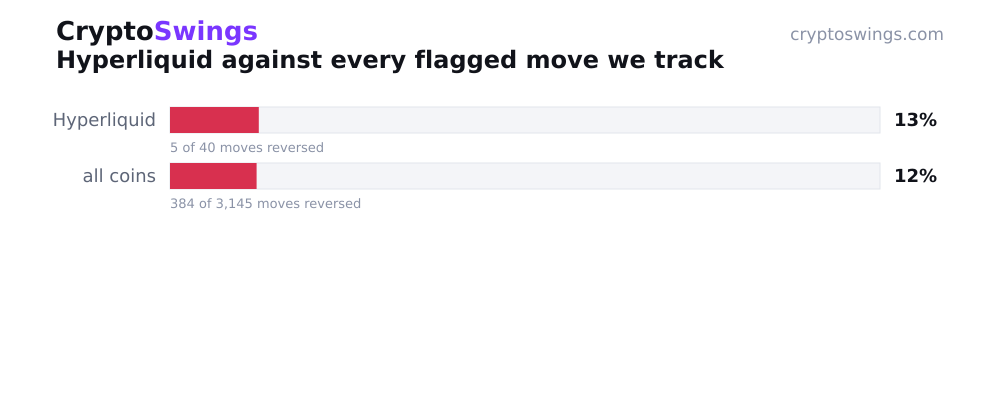
Now the number that actually earns its keep. Hyperliquid reversed within a day on five of its forty flagged moves. Run that out and you get a reversal rate of 12.5 percent.
Hold that next to the baseline. Across every coin tracked, the reversal rate sits at 12.2 percent. HYPE comes in at 12.5. That is not a gap you build a thesis on, it is close enough to average that you could round the difference away and nobody would argue.
Which is its own kind of finding. Some coins are famous for the fake-out, the spike that exists purely to be handed back. Hyperliquid is not one of them. It behaves like a coin that sits squarely in the middle of the pack: when it moves, the move is about as likely to hold as anyone else's, no more prone to the double-cross, no less.
Five reversals out of forty is not chaos. It is a coin that mostly means what it does. The other thirty-five times, whatever direction HYPE picked, it was still pointing roughly that way a day later. On a board where a good chunk of loud moves come with an expiry date, that is worth noting.
This is the sort of thing CryptoSwings keeps a running tally of, which coins keep their footing after a jump and which ones don't.
What Counts As Unusual, and How You Grade It
Worth being clear on the machinery, because "flagged move" and "reversal" only mean something if you know what they mean here.
A flagged move is an automatically detected unusual move, a swing large enough, relative to how the coin normally trades, to stand out from the background noise. Not every wiggle qualifies. The flag is the market doing something out of character, up or down.
The grading is where it gets honest. Each flagged move gets checked against the real market price one day later. If the move held its direction, it counts as holding. If price had swung back the other way, the rally that melted, the sell-off that got bought right back, it counts as a reversal. Every figure in this piece comes from that same test: flag the move, wait, measure against the actual price. No interpretation, no vibe. Just where the number sat then versus where it sat a day on.
So when I say HYPE reversed five times, I mean five flagged moves failed that check. The other thirty-five passed.
What an Altcoin Price Chart Tells You After Hyperliquid Jumps
Here is the question in plain terms: when you look at an altcoin price chart for Hyperliquid and it has just made a sharp move, how likely is that move to reverse within a day?
The direct answer: about 12.5 percent of the time, based on five reversals across the forty unusual moves flagged between June 5 and August 16, 2026. Put the other way, roughly seven out of every eight flagged HYPE moves were still pointing the same direction a day later.
That is the useful thing to carry away from Hyperliquid's chart. It is not a coin built on the head-fake. When it spikes, the spike tends to survive the day; when it slides, the slide tends to stick. The reversal is the exception, not the rhythm, and at 12.5 percent against an all-coin average of 12.2, it is an exception that shows up at almost exactly the ordinary rate.
For anyone reading the chart, that translates to a fairly boring virtue: HYPE's moves have been more trustworthy-looking than the flashiest names on the board, simply because so few of them came unglued the next day.
The Edges of What This Can Tell You
Now the fine print, because a clean number deserves an honest boundary around it.
This is a record, not a crystal ball. Everything here describes what Hyperliquid already did between June 5 and August 16, 2026 - forty flagged moves, five reversals, a typical swing of 4 percent, a top of 11. It does not say what the next flagged move will do. A coin that held its direction thirty-five times out of forty can still turn on the forty-first, and no reversal rate promises otherwise.
The window is fixed, and it is not enormous. A little over two months, forty flagged moves. That is a real sample, enough to sketch a pattern, but it is a snapshot of one stretch of summer, not a lifetime of behavior. Stretch the window, add a rougher patch of market, and the split between those eighteen rallies and twenty-two sell-offs could shift, and the reversal rate with it.
And there is a filtering point worth naming: this only counts moves large enough to get flagged as unusual in the first place. The quiet drift, the ordinary day-to-day chop, none of that is in here. HYPE could be doing all sorts of small things off-camera that never trip the flag and never enter this tally. What you are seeing is the loud stuff, graded against the price a day later, the notable moves and their follow-through, nothing more and nothing less.
What would change the picture? A longer window, a nastier market, or simply more flagged moves to weigh. Until then, the shape stands as recorded: Hyperliquid made forty noticeable moves this summer, and five of them thought better of it. The rest held their ground.