Tectonic Flashed 2,000% And Kept Almost None Of It
A Loud Day With A Very Quiet Ending
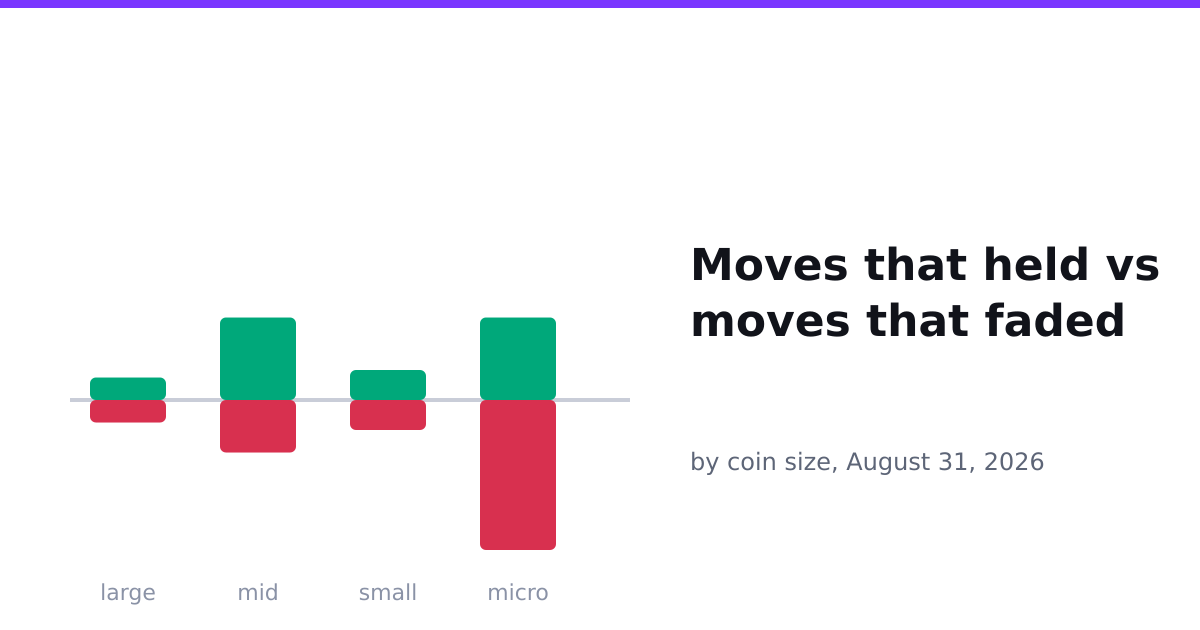
The wider crypto market on August 31, 2026 was not calm so much as busy. Sixty-three unusual moves ran their full course, seven of them ended as confirmed pump and dumps, and the tape spent the day handing out big numbers with one hand and taking them back with the other. No single headline dragged everyone along. Instead the drama pooled in the corners, where a handful of small coins did enough shouting for the whole board.
One of them shouted louder than the rest.
The Coin That Rose Twenty Times And Fell Back To Earth
Tectonic began the day as an ordinary small-cap, the kind of name that scrolls past without comment. Then it did something extraordinary. At its peak the move measured 2,077.5%, a candle worth more than twenty times where it started, the sort of print that makes you check the axis twice to be sure the chart isn't broken.
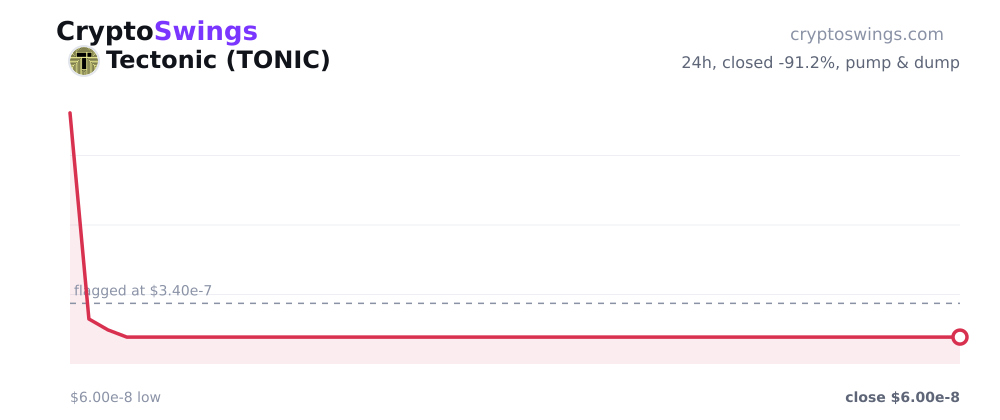
It was broken, in a sense, just not the chart. A move of that scale is a promise, and this one was written on water. By the close Tectonic had given nearly all of it back, finishing the day down 91.2% and stamped as a confirmed pump and dump. Sentiment had leaned bullish going in. That read did not survive contact with the tape. The peak and the close were separated by almost the entire distance a coin can fall.
YOLO Lived Up To Its Name
Down in the micro-cap weeds, YOLO put on a more modest show. Its flagged move topped out near 96.7%, a clean near-doubling, urgent and convincing while it lasted.
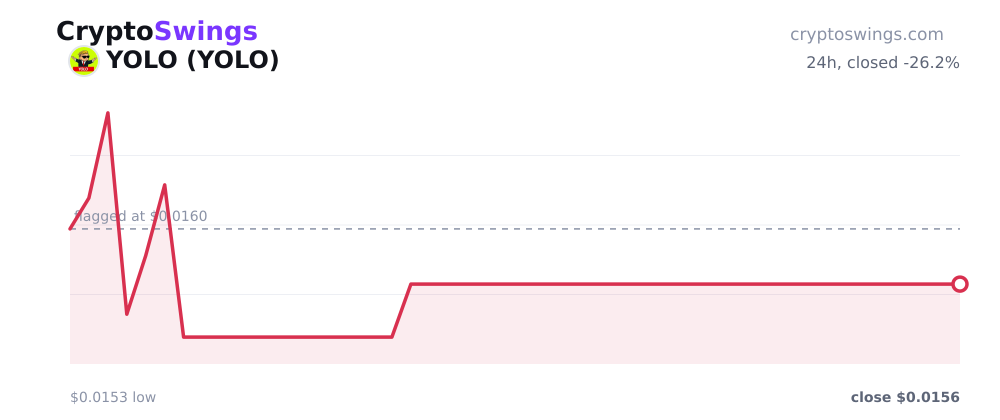
It did not last. YOLO closed the day down 26.2%, a fade rather than a collapse, and notably not a confirmed pump and dump. Sentiment had narrowly leaned bullish, though on the important question, whether the coin would hold or slip, the read landed on the right side. The move faded the way these small runs tend to. Everyone who arrived early got a story to tell. Everyone who arrived late got a lesson.
The One That Actually Held On
Then there was 牛来 (Niu Lai), another micro-cap, and the day's rarest species: a coin that spiked and then mostly kept it. Its move was flagged at 65.3%, smaller than the other two headliners.
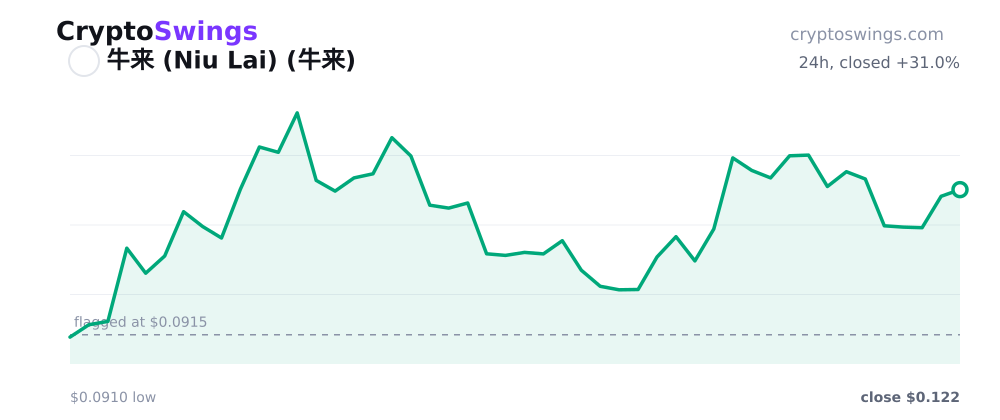
But when the dust settled, Niu Lai was still up 31%. Not the full spike, but a genuine, durable gain rather than a mirage. Sentiment had leaned strongly bullish here, and this time the tape agreed. In a day defined by numbers that evaporated, holding onto roughly half your move counted as heroism.
The Shape Of The Whole Board
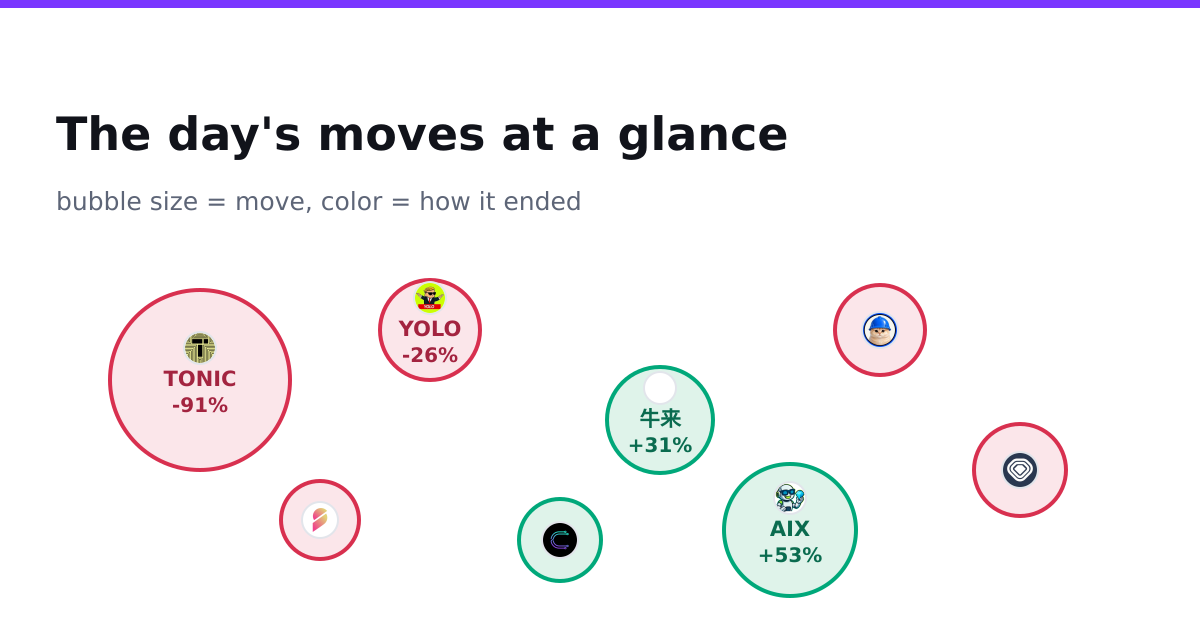
Line the three up and the day writes its own lesson. Tectonic printed the largest number and kept almost none of it. YOLO printed a big one and gave most of it back. Niu Lai printed the smallest of the three and held the most. The size of the spike told you almost nothing about the size of the reward.
That was the texture of August 31 across the board. Seven confirmed pump and dumps out of sixty-three completed moves means the fakeouts were a minority, but they were the loud minority, and the loudest of them by far was Tectonic. The optimism running through the day, meanwhile, was only right about 36% of the time according to data compiled by CryptoSwings, which is another way of saying most of the confidence in the room was pointed the wrong direction.
What The Tape Was Actually Saying
A day like this rewards patience and punishes reflex. The biggest candle on the board was also the biggest trap, and the coin that behaved best barely made the highlight reel while it was climbing. Tectonic's round trip, up twenty-fold, then down 91.2%, is the kind of move that looks like opportunity in the moment and like a warning in hindsight.
The market on August 31 was not short on excitement. It was short on follow-through. Big numbers arrived all day; the ones that were still standing at the close were the smaller, quieter ones nobody screenshotted. That is worth remembering the next time a chart looks broken in the right direction.